Motor Testing and Characterization Platform
A bench platform for characterizing a D6374 150kv BLDC motor across static parameters, no-load dynamics, and flywheel-loaded spin-up, using two different controllers (ODrive 3.6 and MKS VESC 75200) as cross-validation. The strongest outputs are not a single dyno number but the test structure, the explicit separation of motor behavior from controller artifacts, and the iteration history behind each result.
Status: six closed findings across static, dynamic, and friction characterization, cross-validated on two controllers. Loaded steady-state testing blocked on a known flywheel identifiability issue (isolation plan written).
Why I built this
I want to design humanoid robot actuators, and characterizing a BLDC from scratch is the honest prerequisite. I wanted Kt, friction, inertia, and thermal behavior as numbers I derived myself, not datasheet values I took on faith. So I built the bench, ran the same motor through both an ODrive and a VESC, fried one of them along the way, and ended up with results I understand from the instrument up.
Closed results
| Finding | Result | Signal |
|---|---|---|
| Kt cross-validation | 0.0551 / 0.0558 Nm/A (1.3% agreement) | Two independent controllers confirm the same physical constant |
| Kv | 143.6 ± 0.7 RPM/V over 5 points | 4.3% below datasheet; tight bench spread |
| Sensorless observer overhead | 0.85 A | Quantified by running both sensored and sensorless on the same motor |
| Rotor inertia | 170–175 g·mm² | Matched spin-up / coast-down technique, friction-independent extraction |
| Friction after casing rebuild | 45% Tc/J drop, 100× repeatability improvement | Isolated a rotor rub, proved it with before / after data |
| Multi-current inertia drift | Telemetry bias, not mechanical | Ruled out by holding friction constant; drift persisted identically |
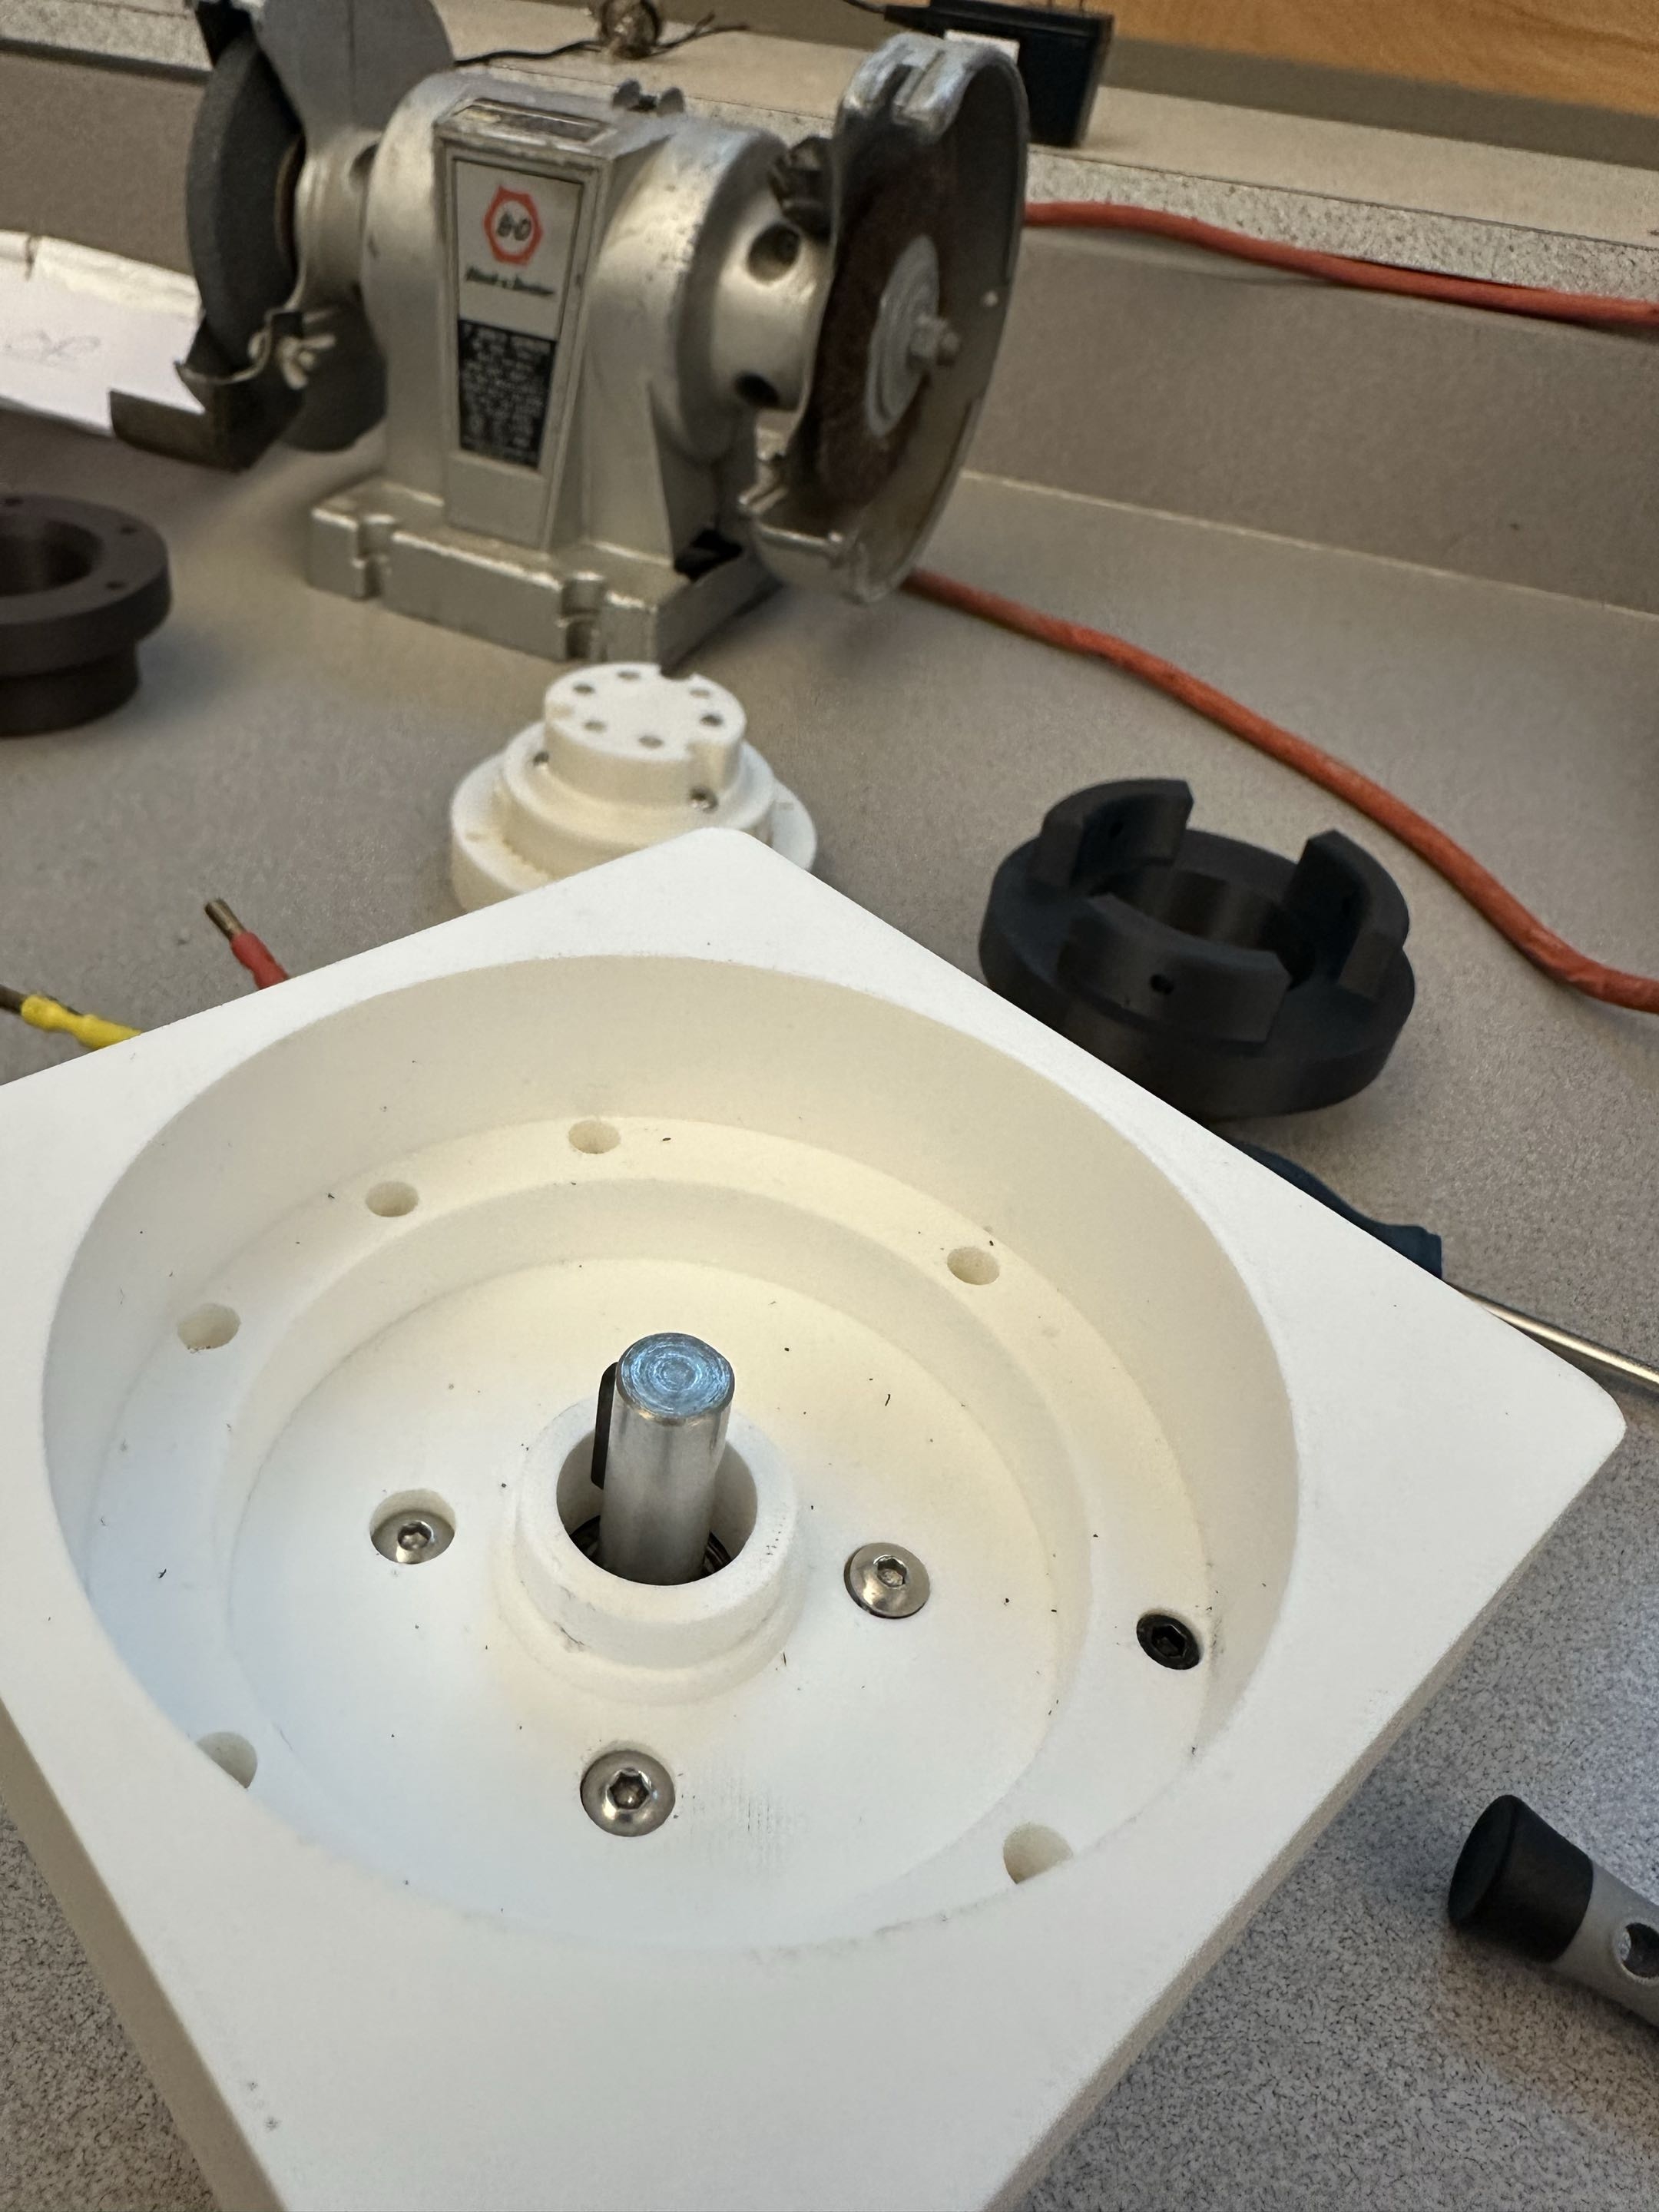
Platform
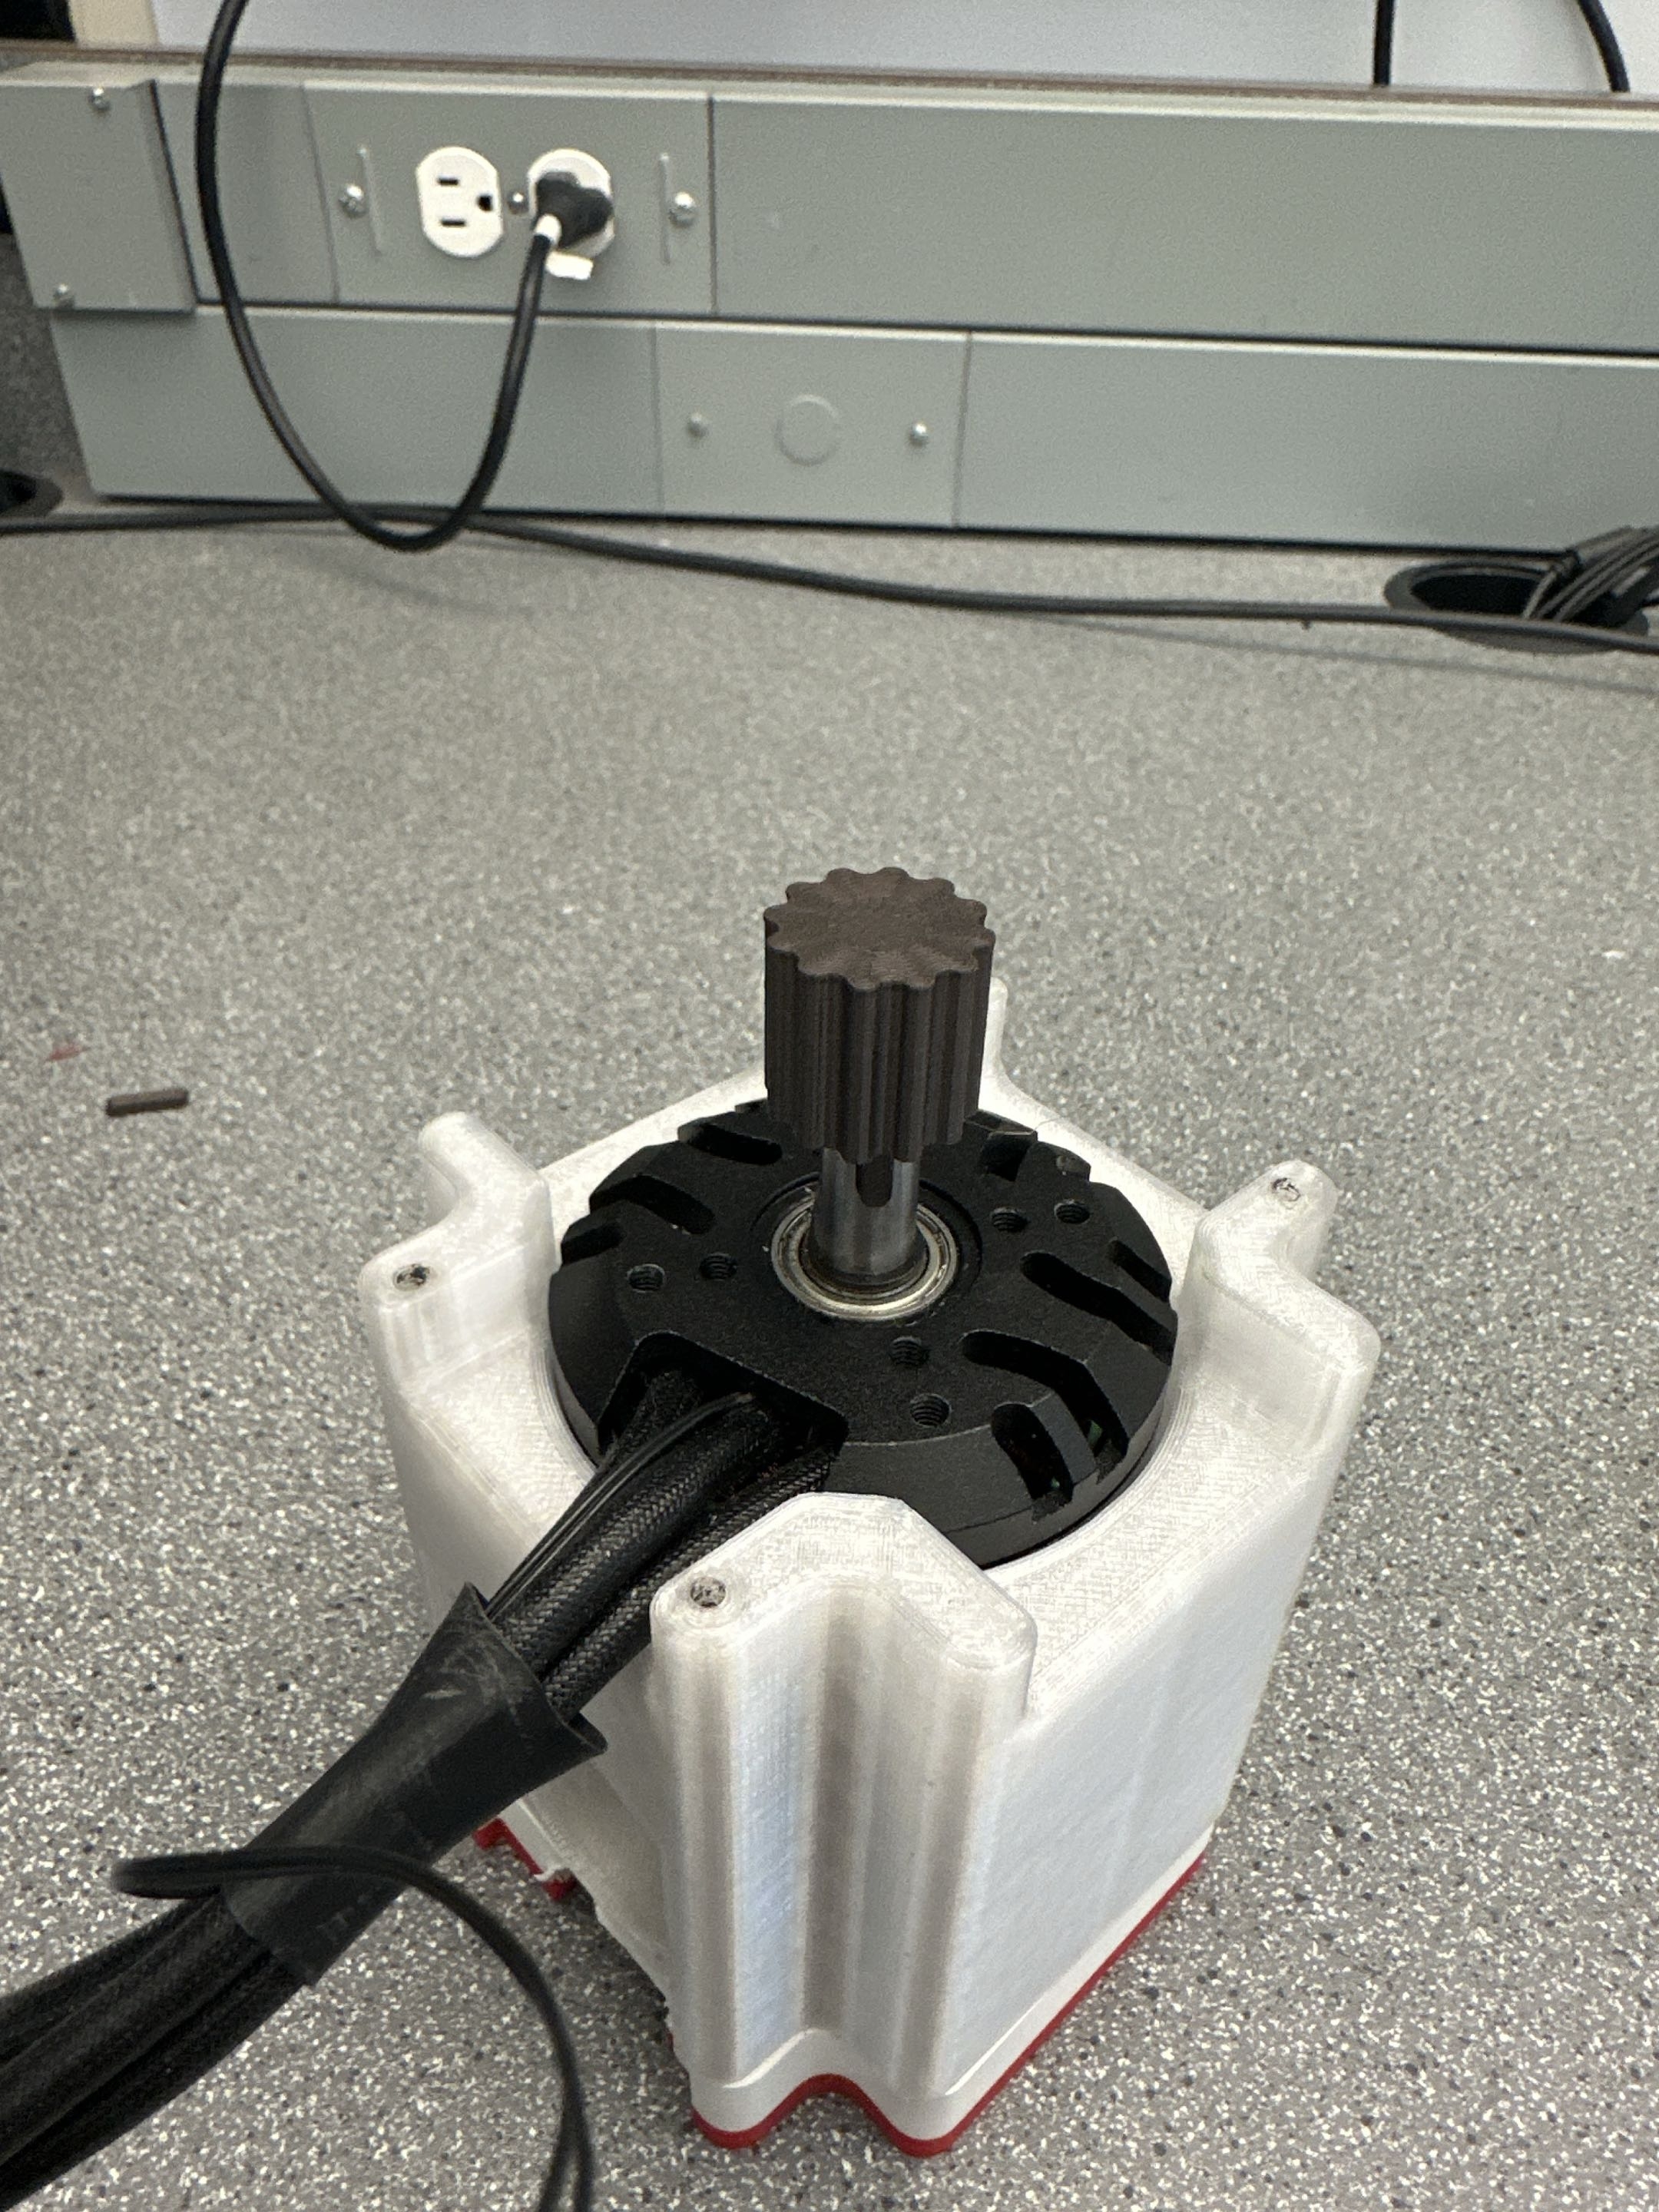
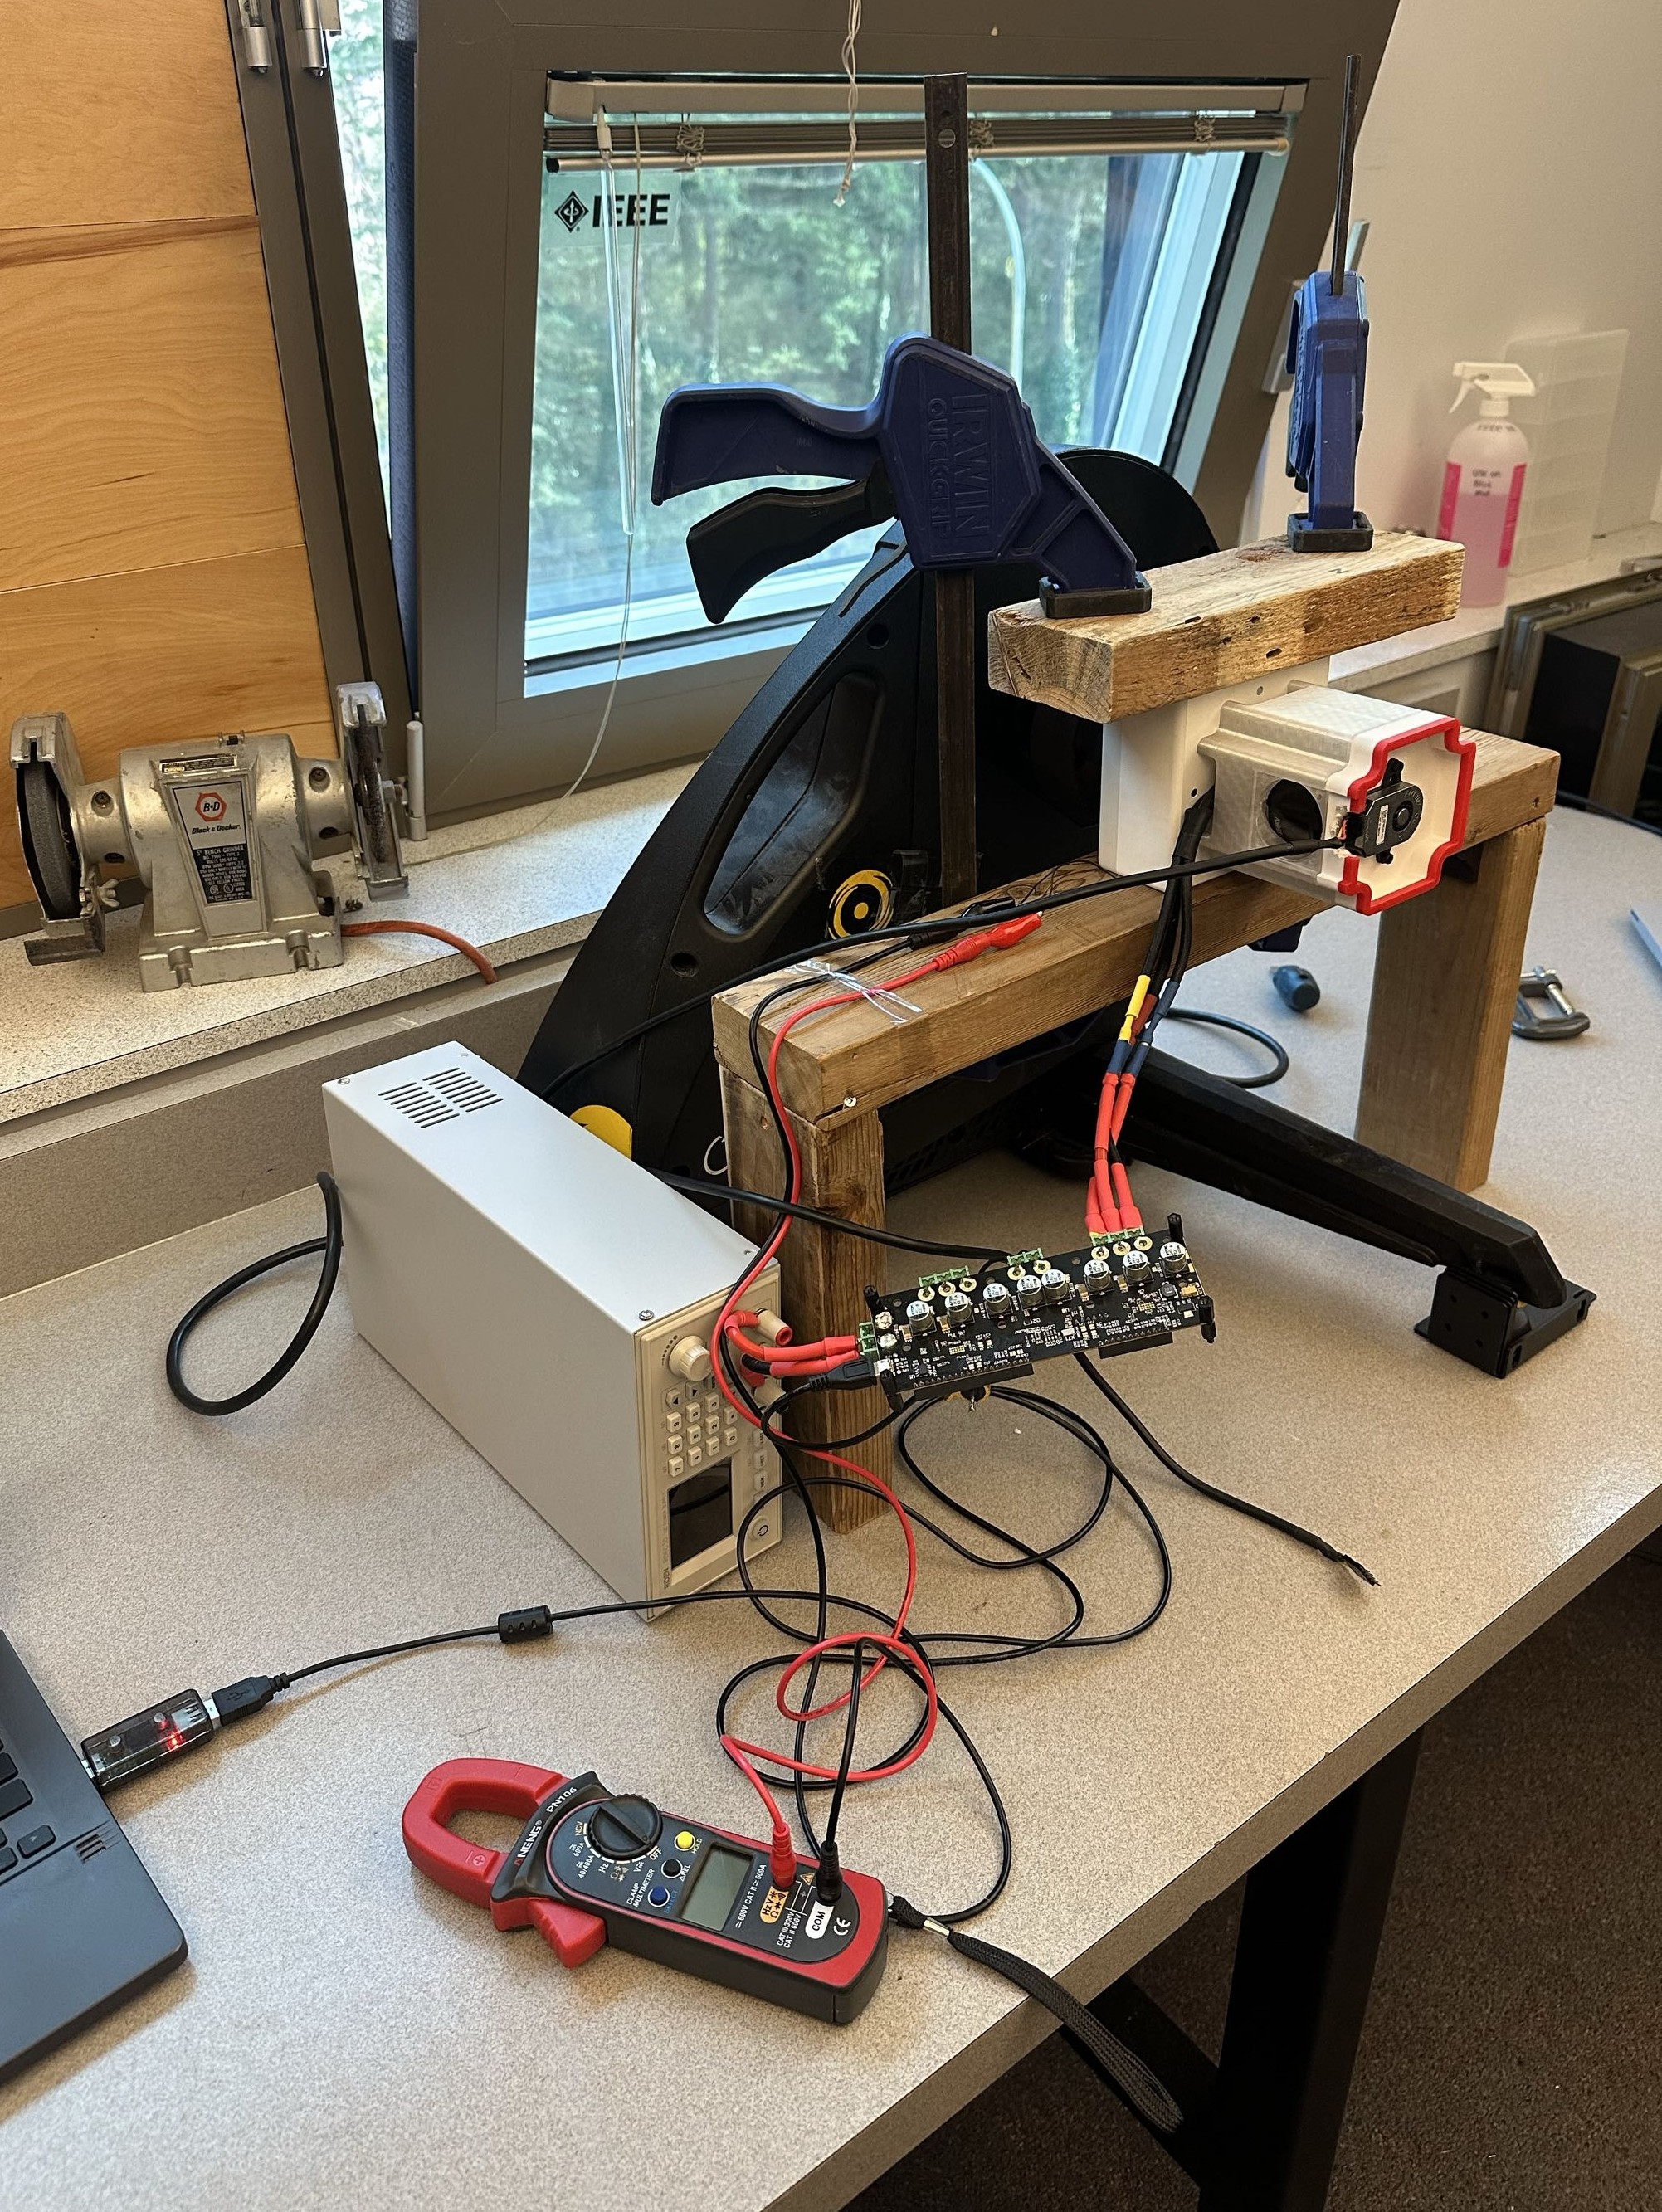
- Motor: D6374 150kv BLDC, 7 pole pairs, star-wound
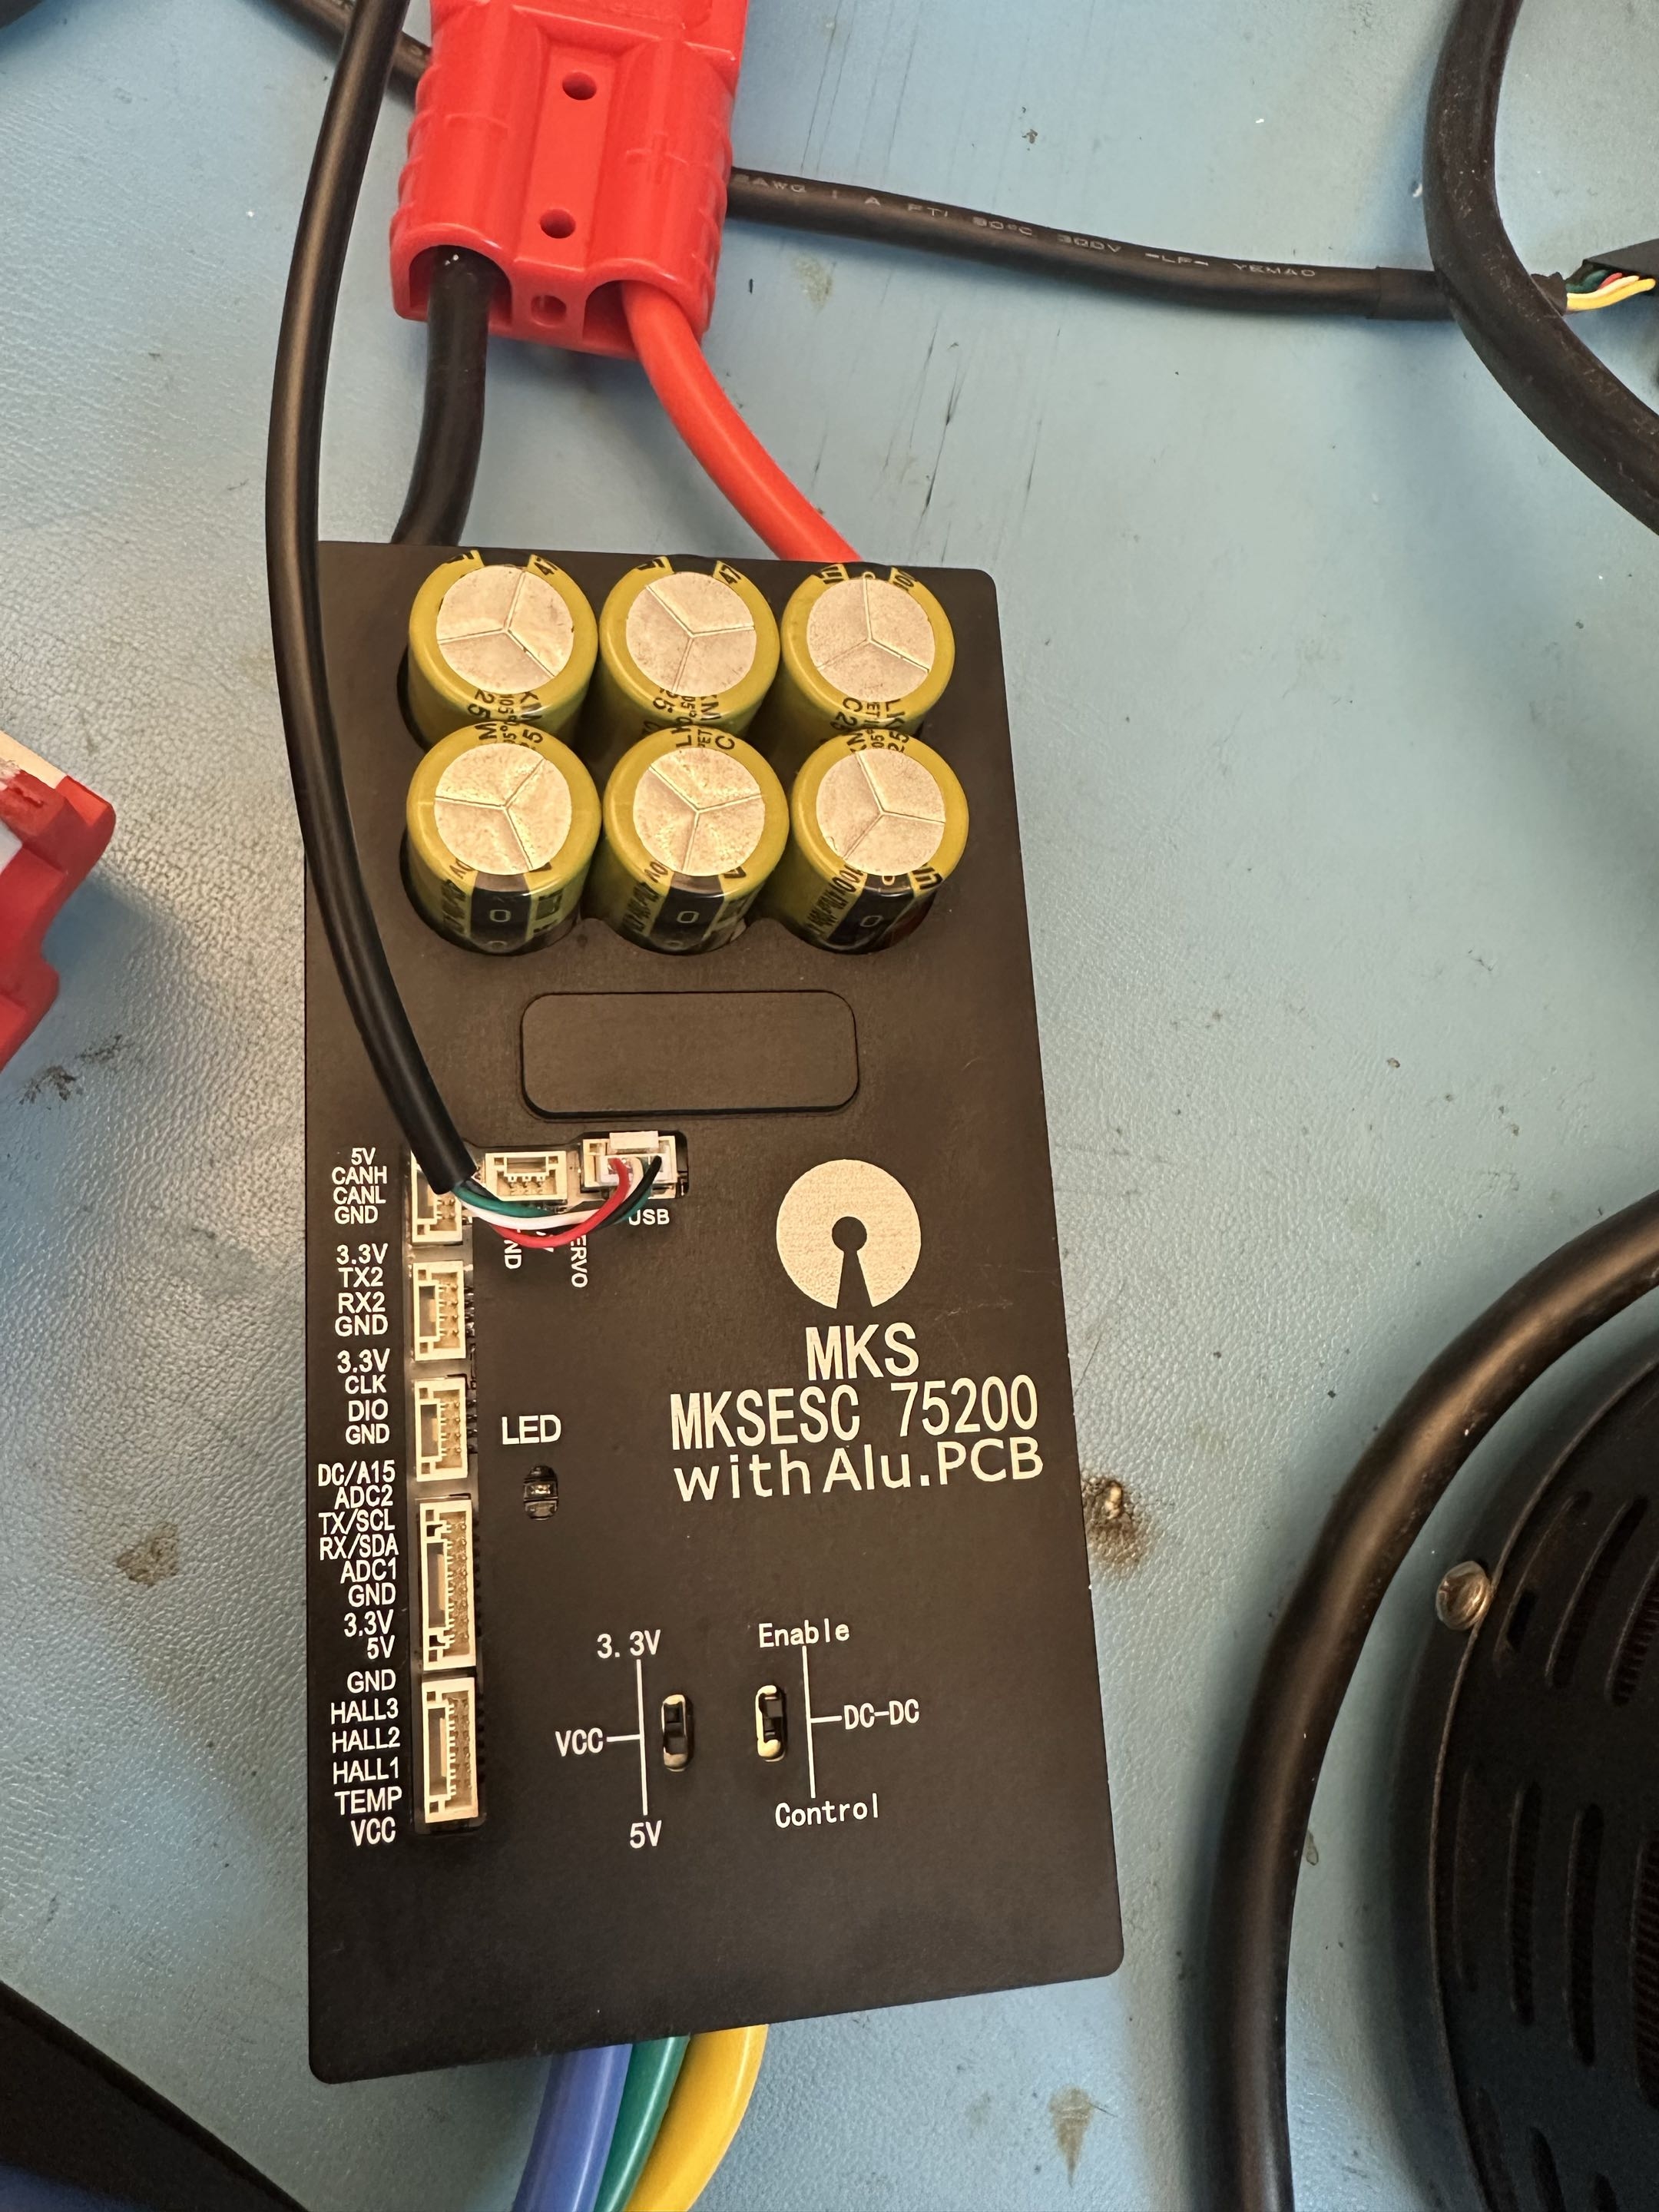
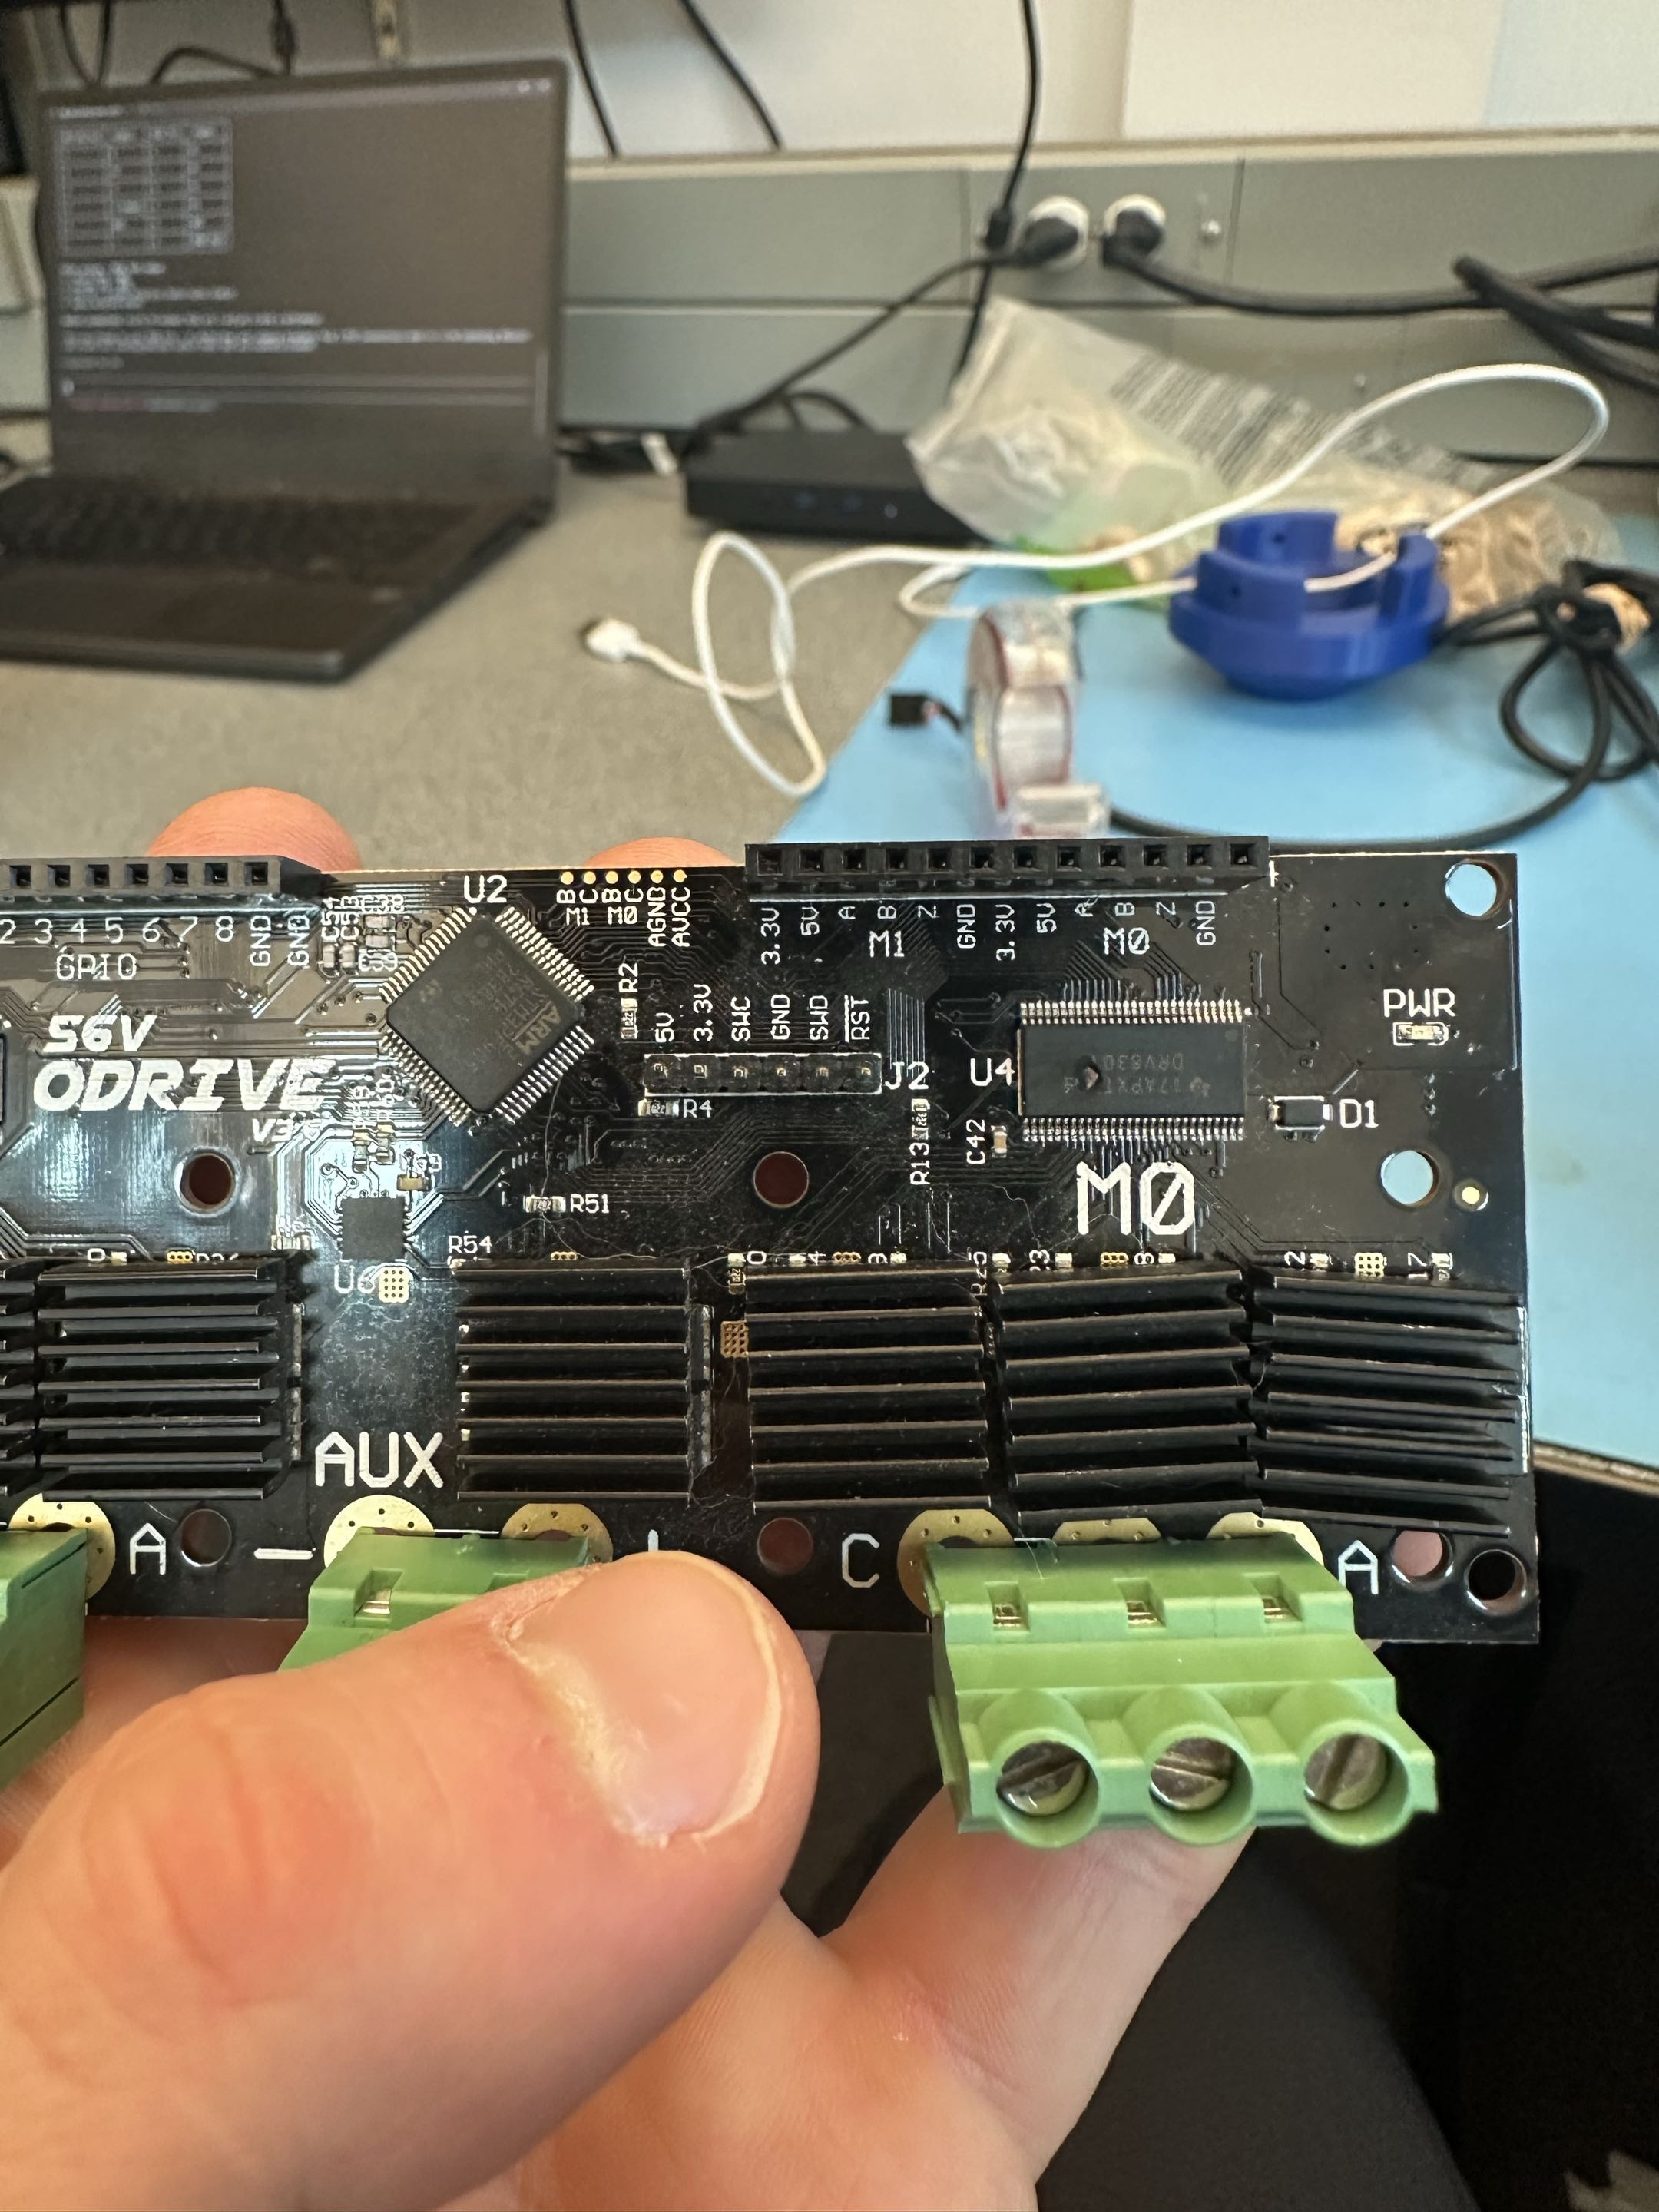
- Controllers: ODrive 3.6 (sensored, 19 A ceiling after M0 FET failure) and MKS VESC 75200 V2 (200 A hardware max)
- Encoder: CUI AMT-102, 8192 CPR, ABI mode
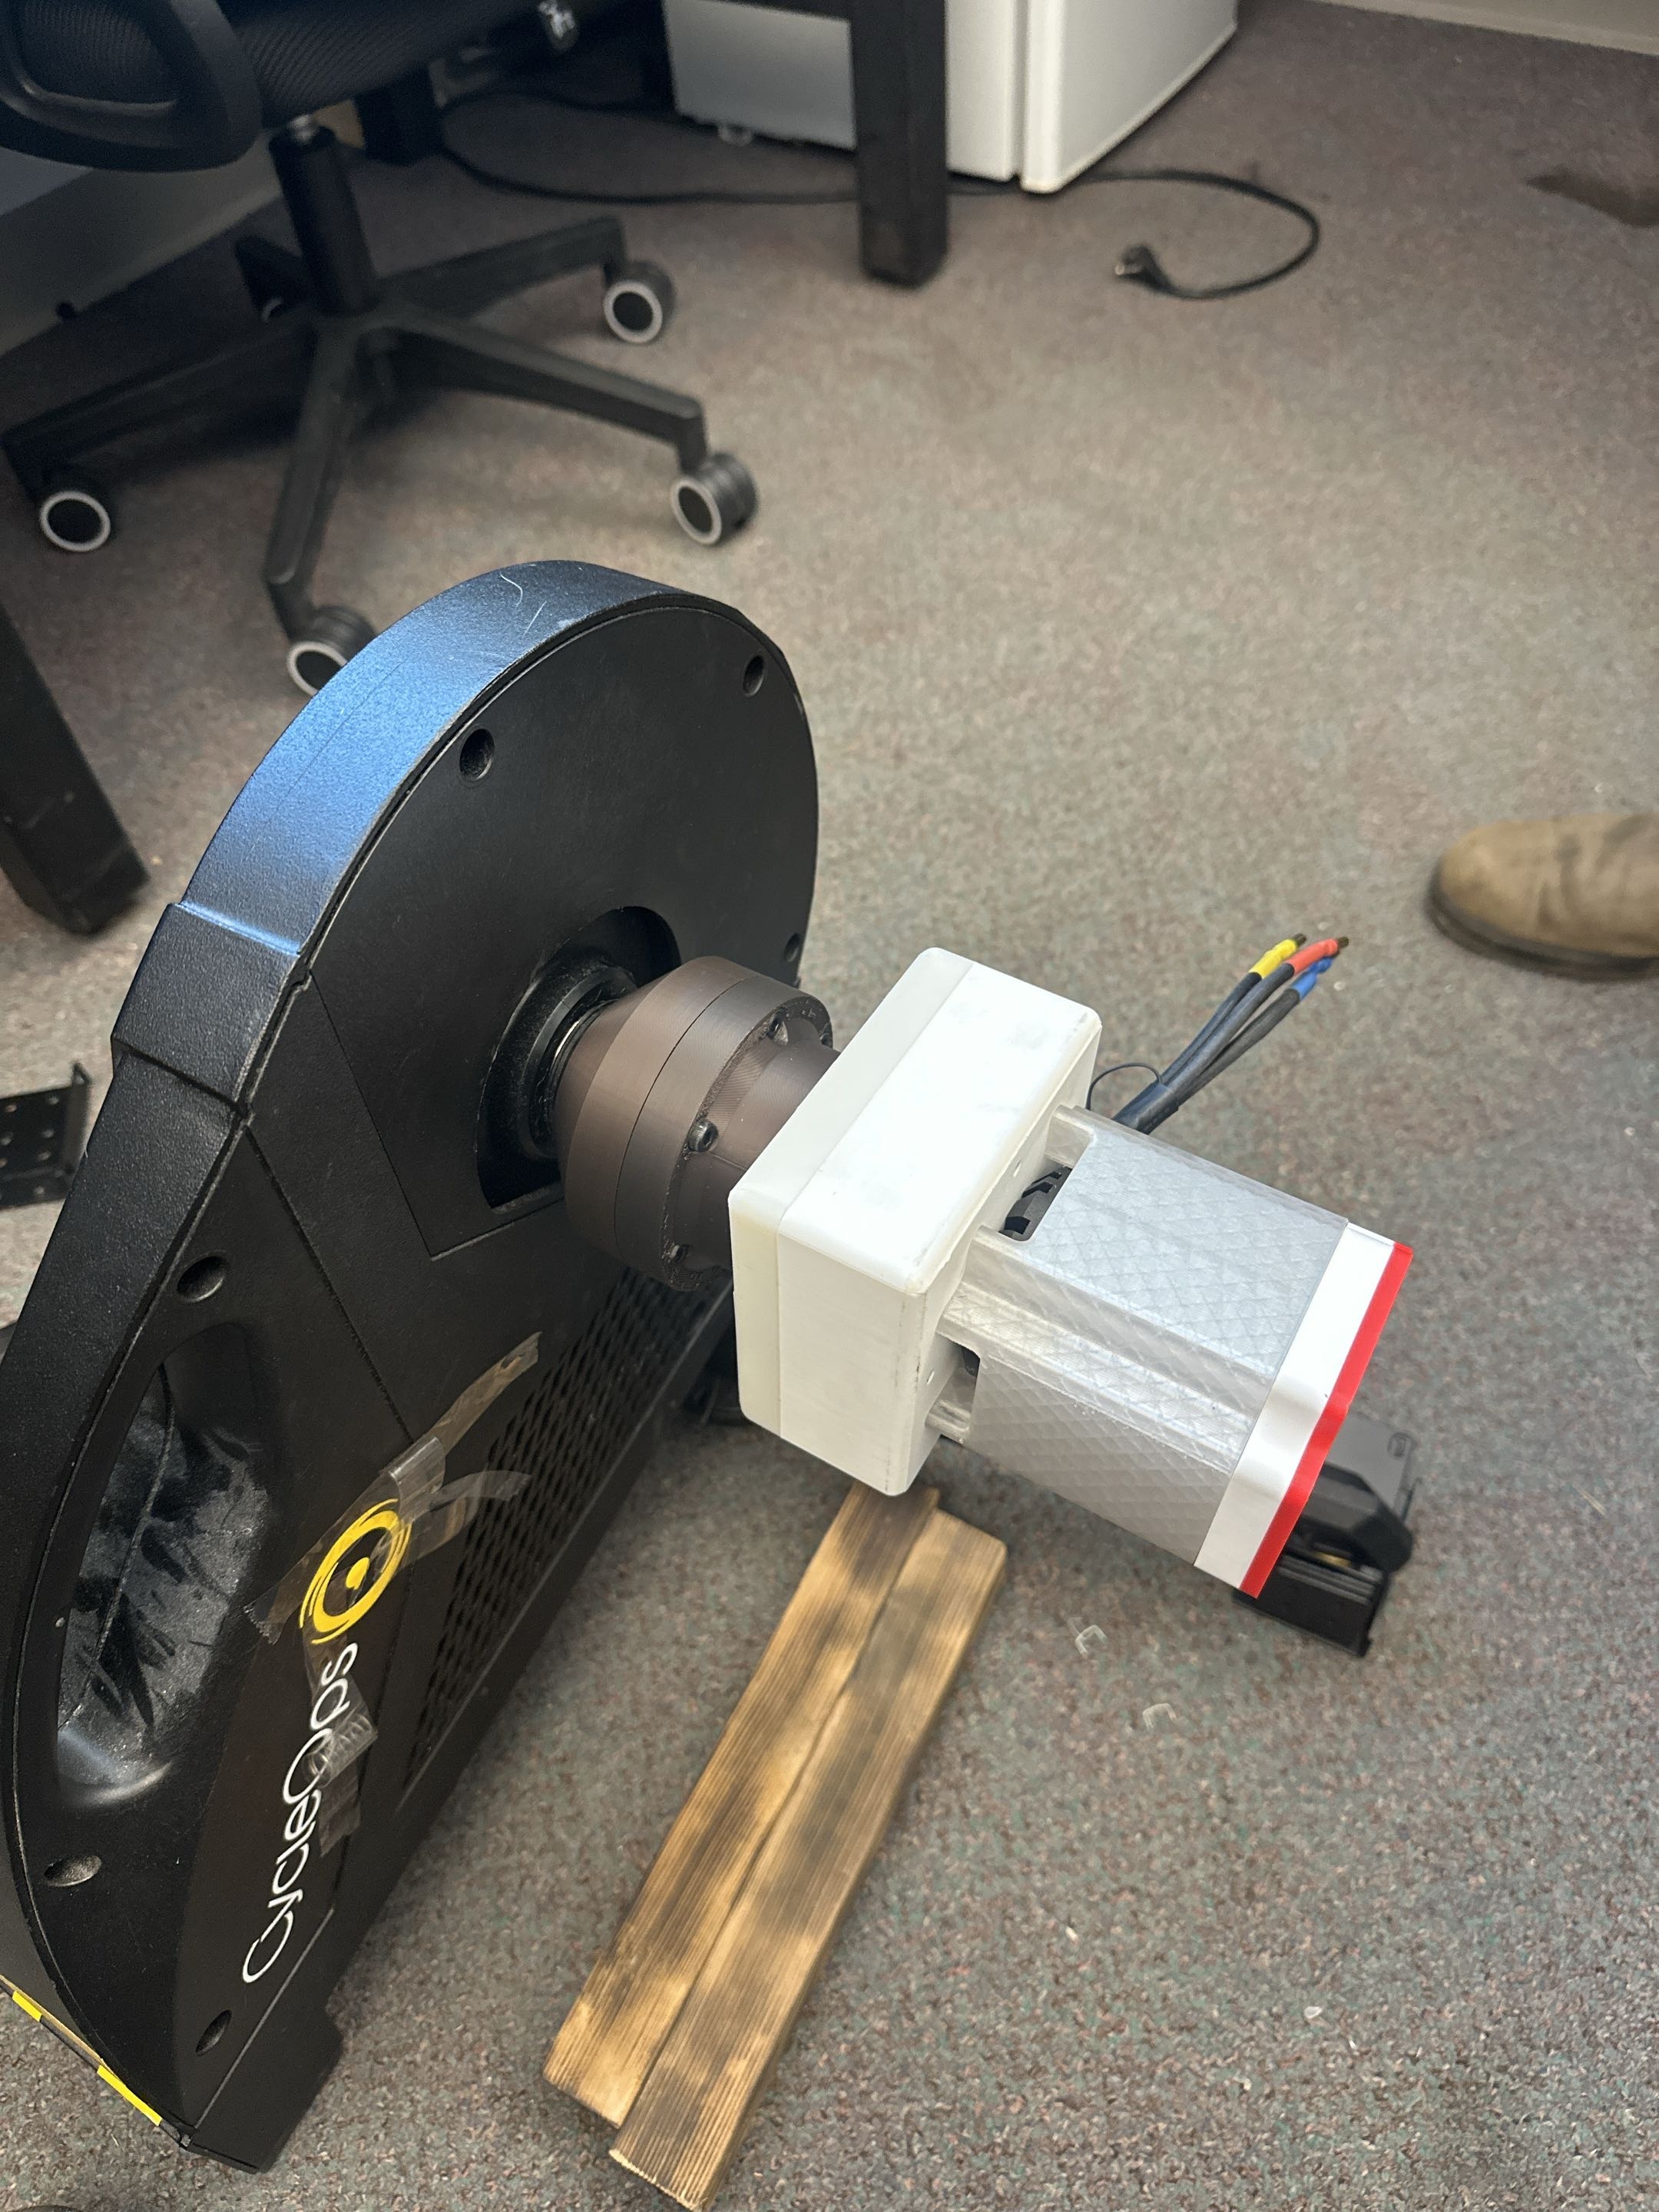
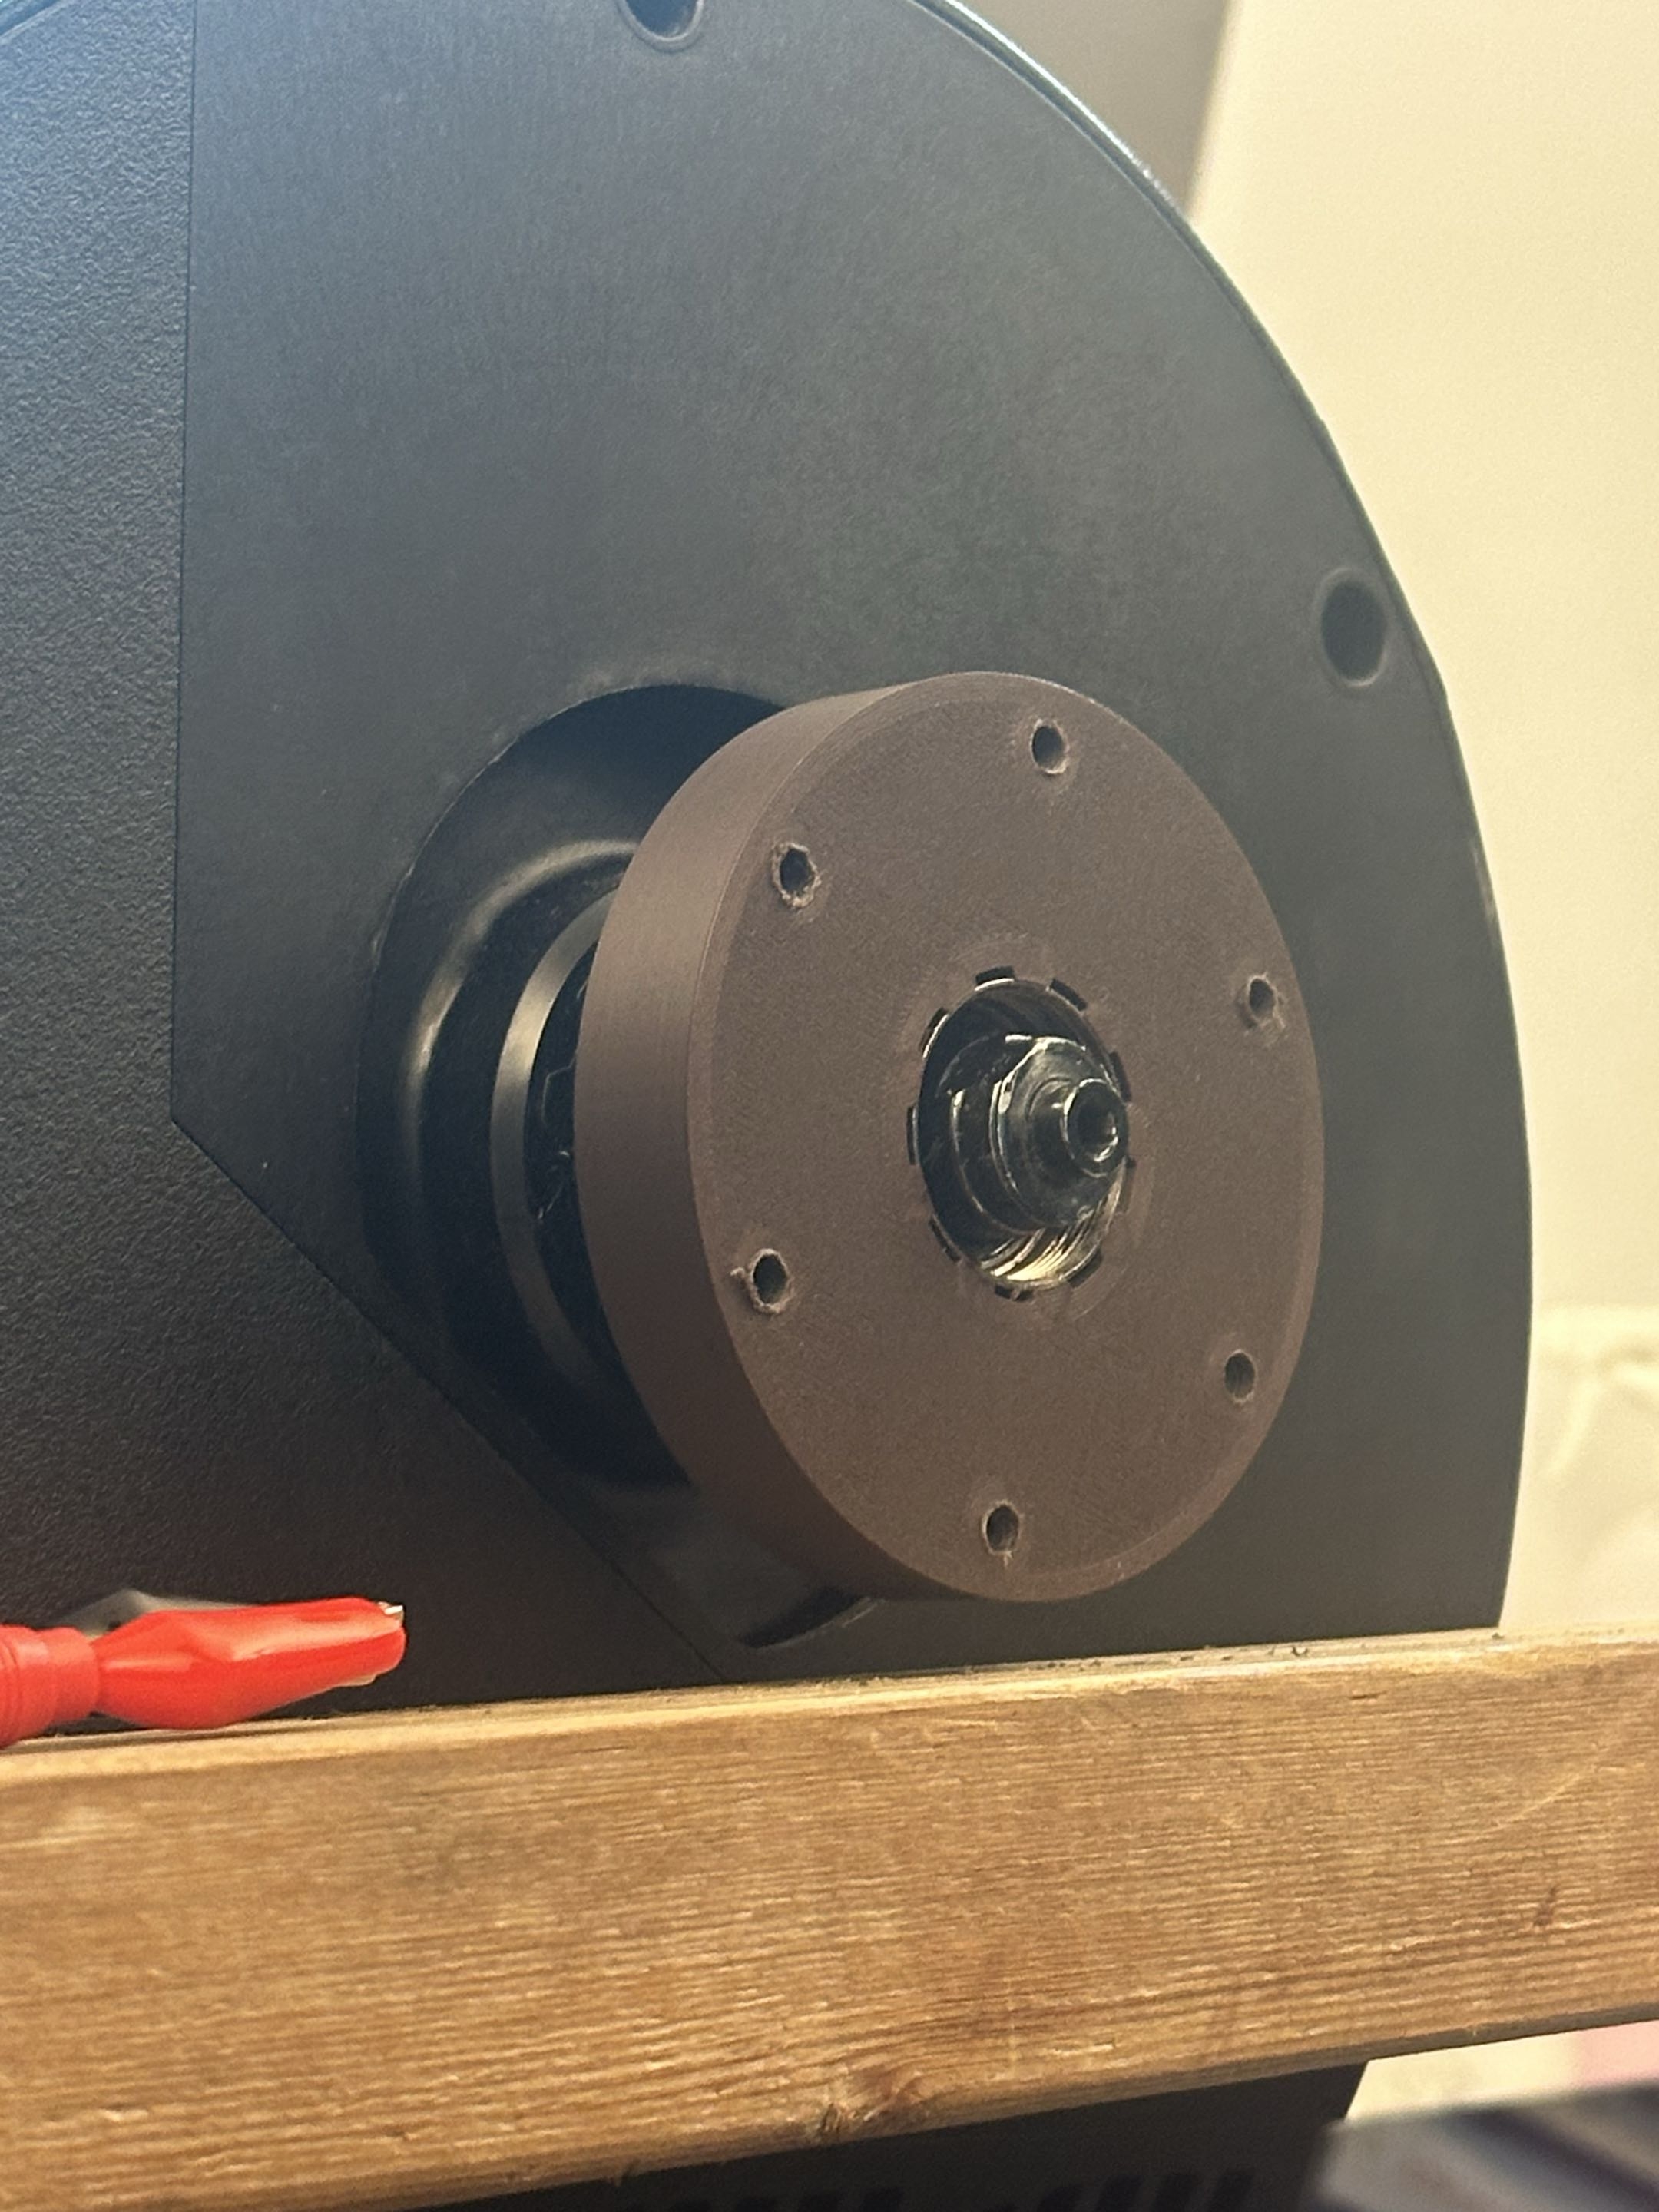
- Load path: 5:1 custom 3D-printed planetary gearbox into Saris H2 freehub, ~9 kg flywheel + eddy-current brake
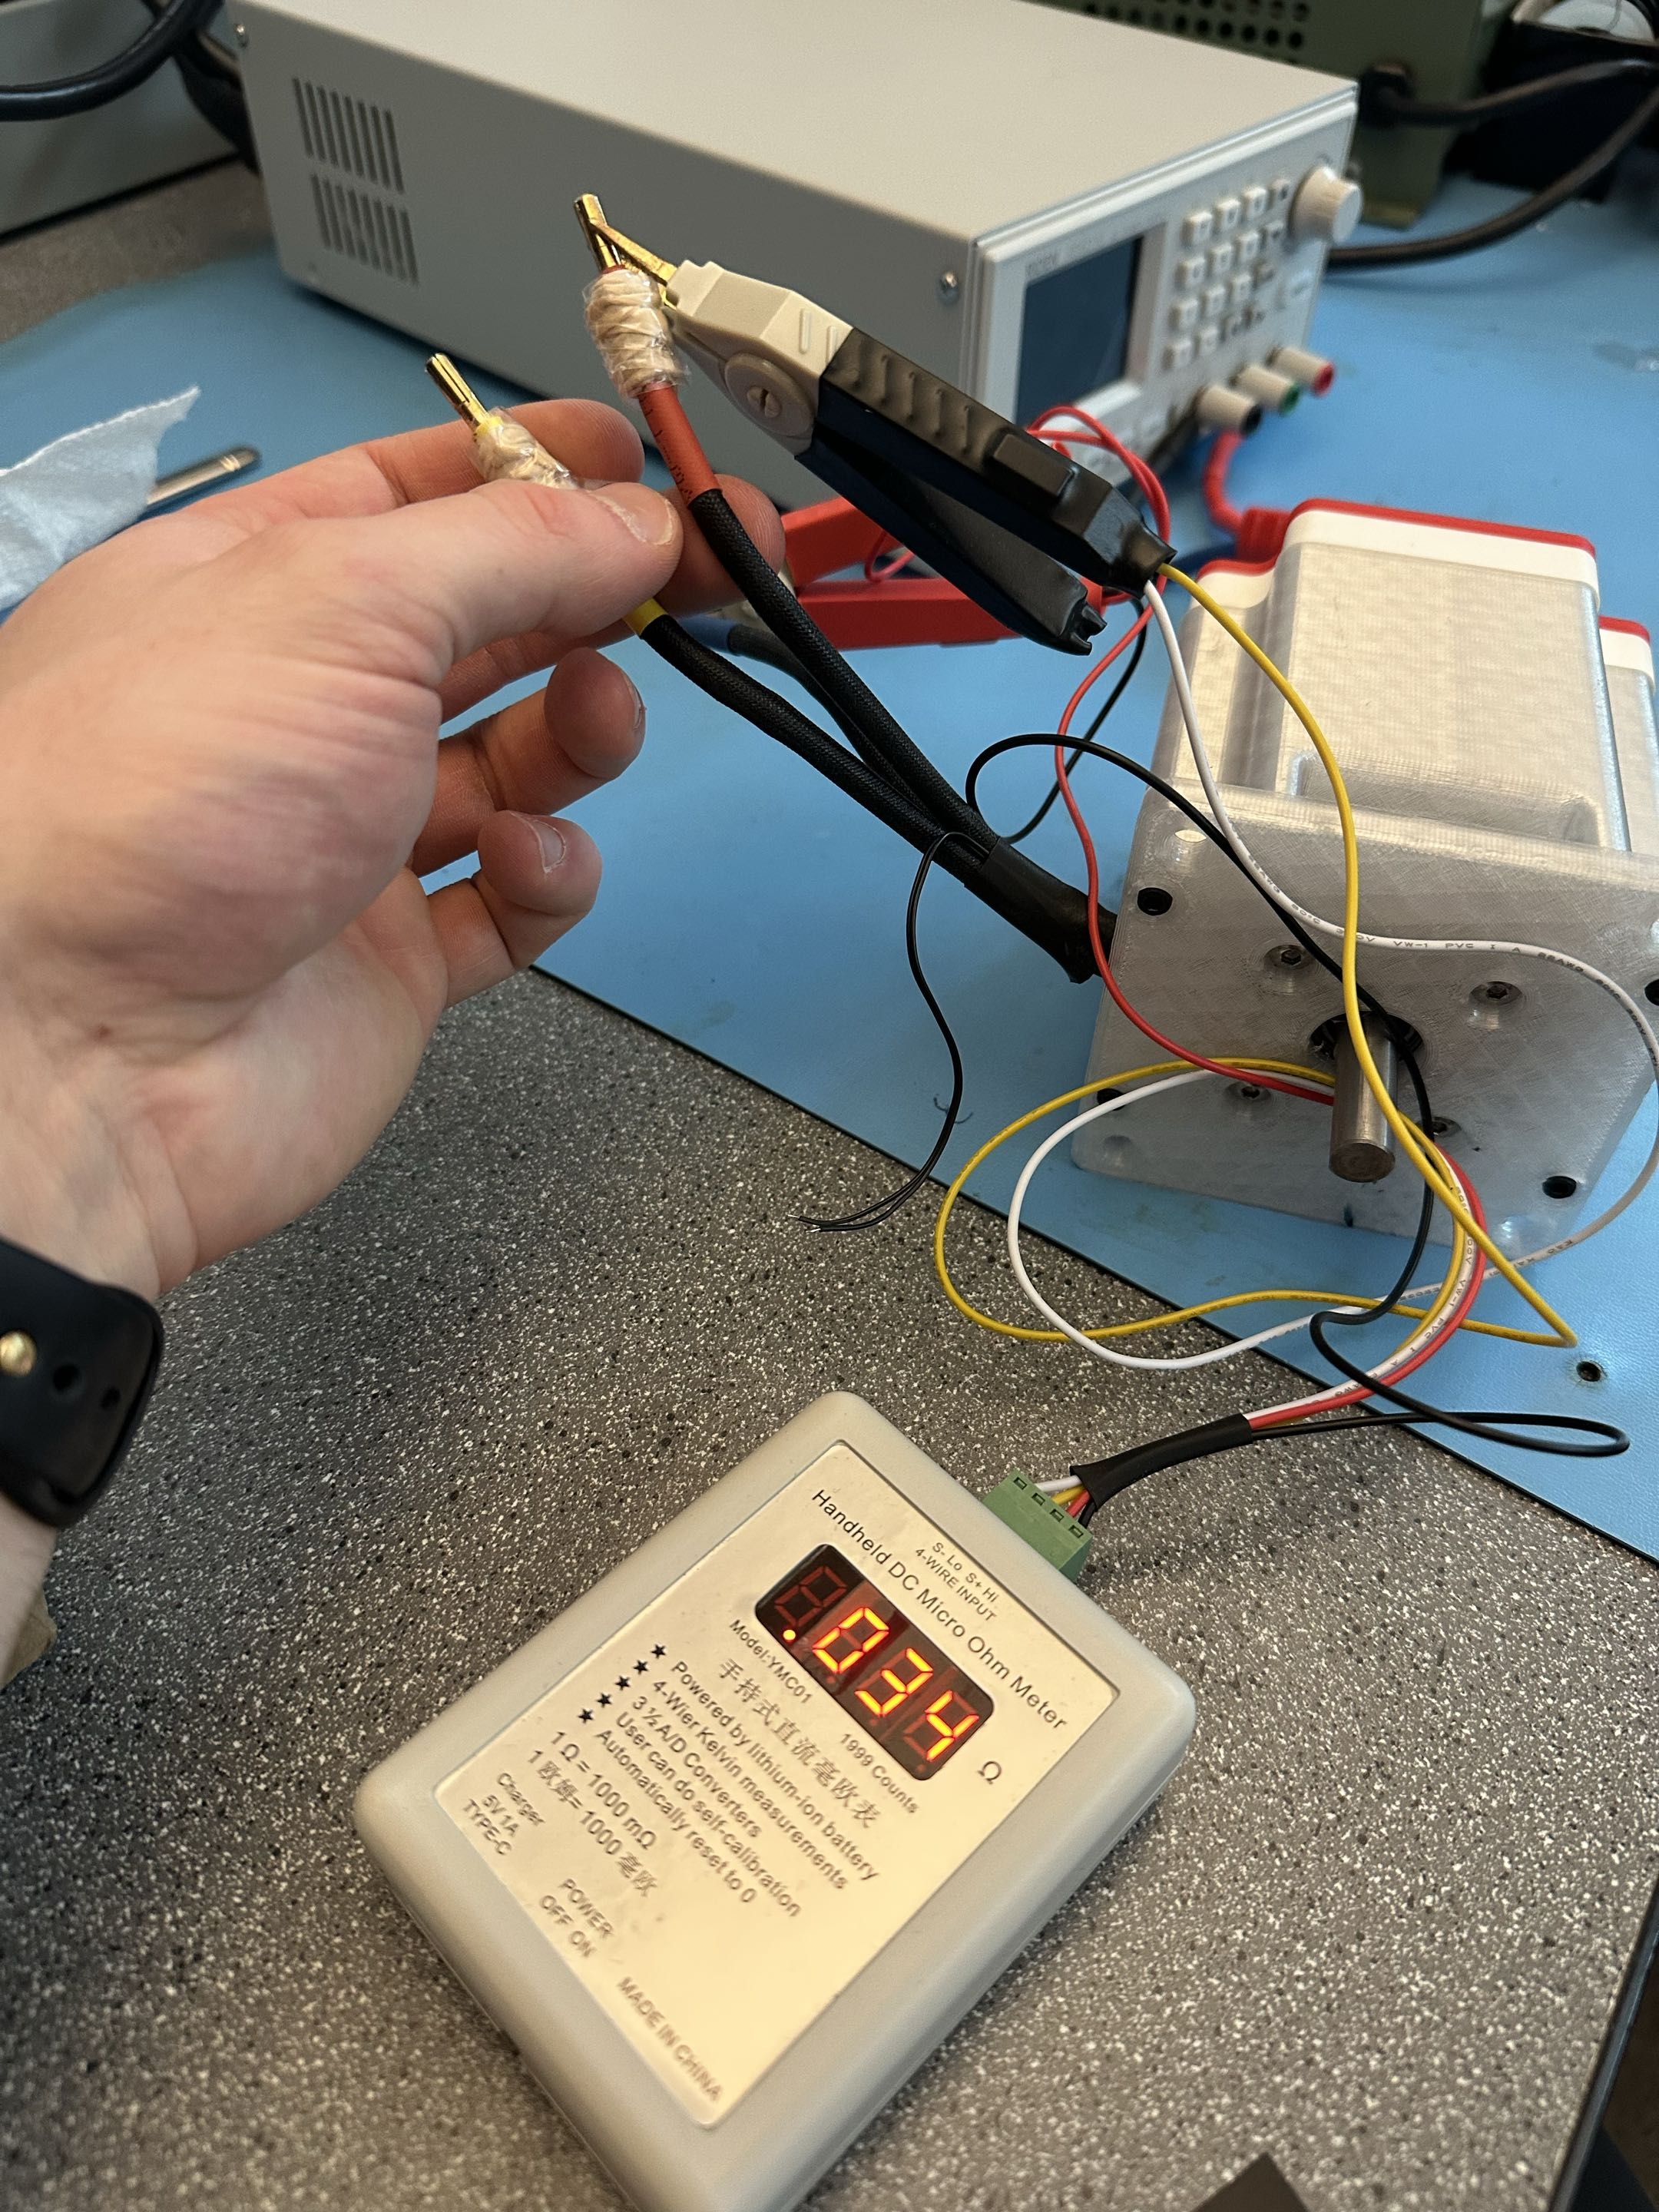
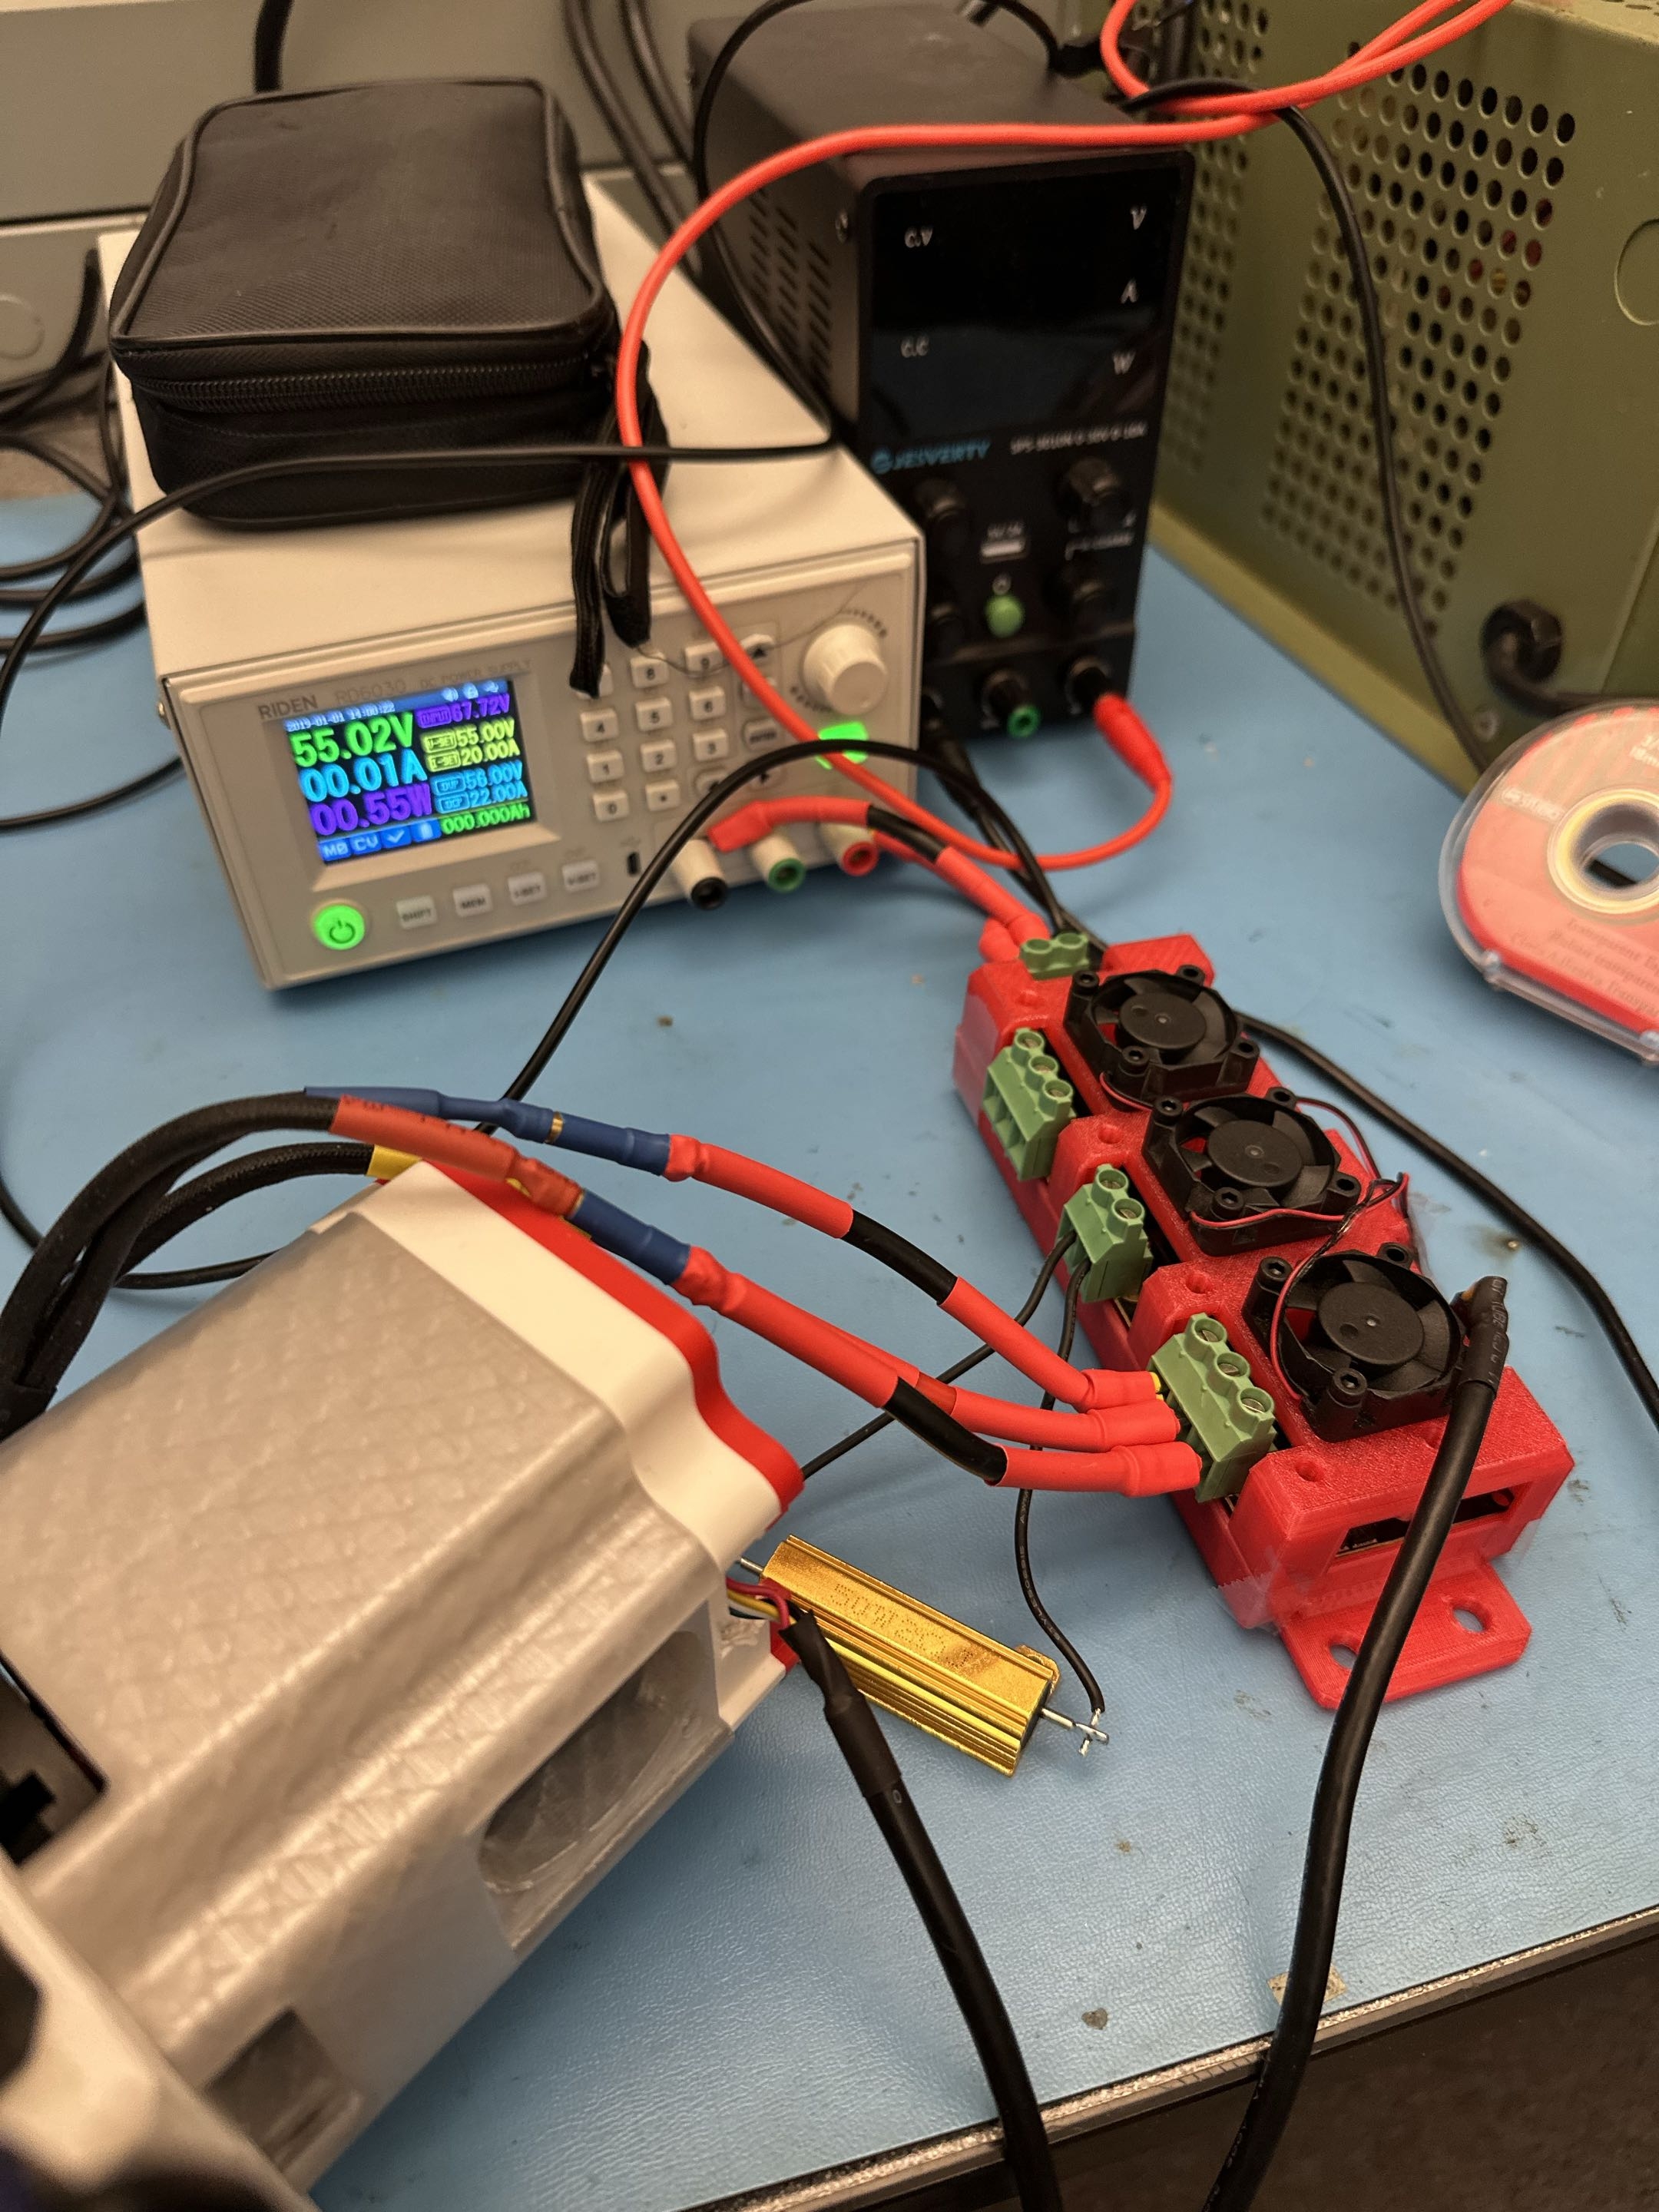
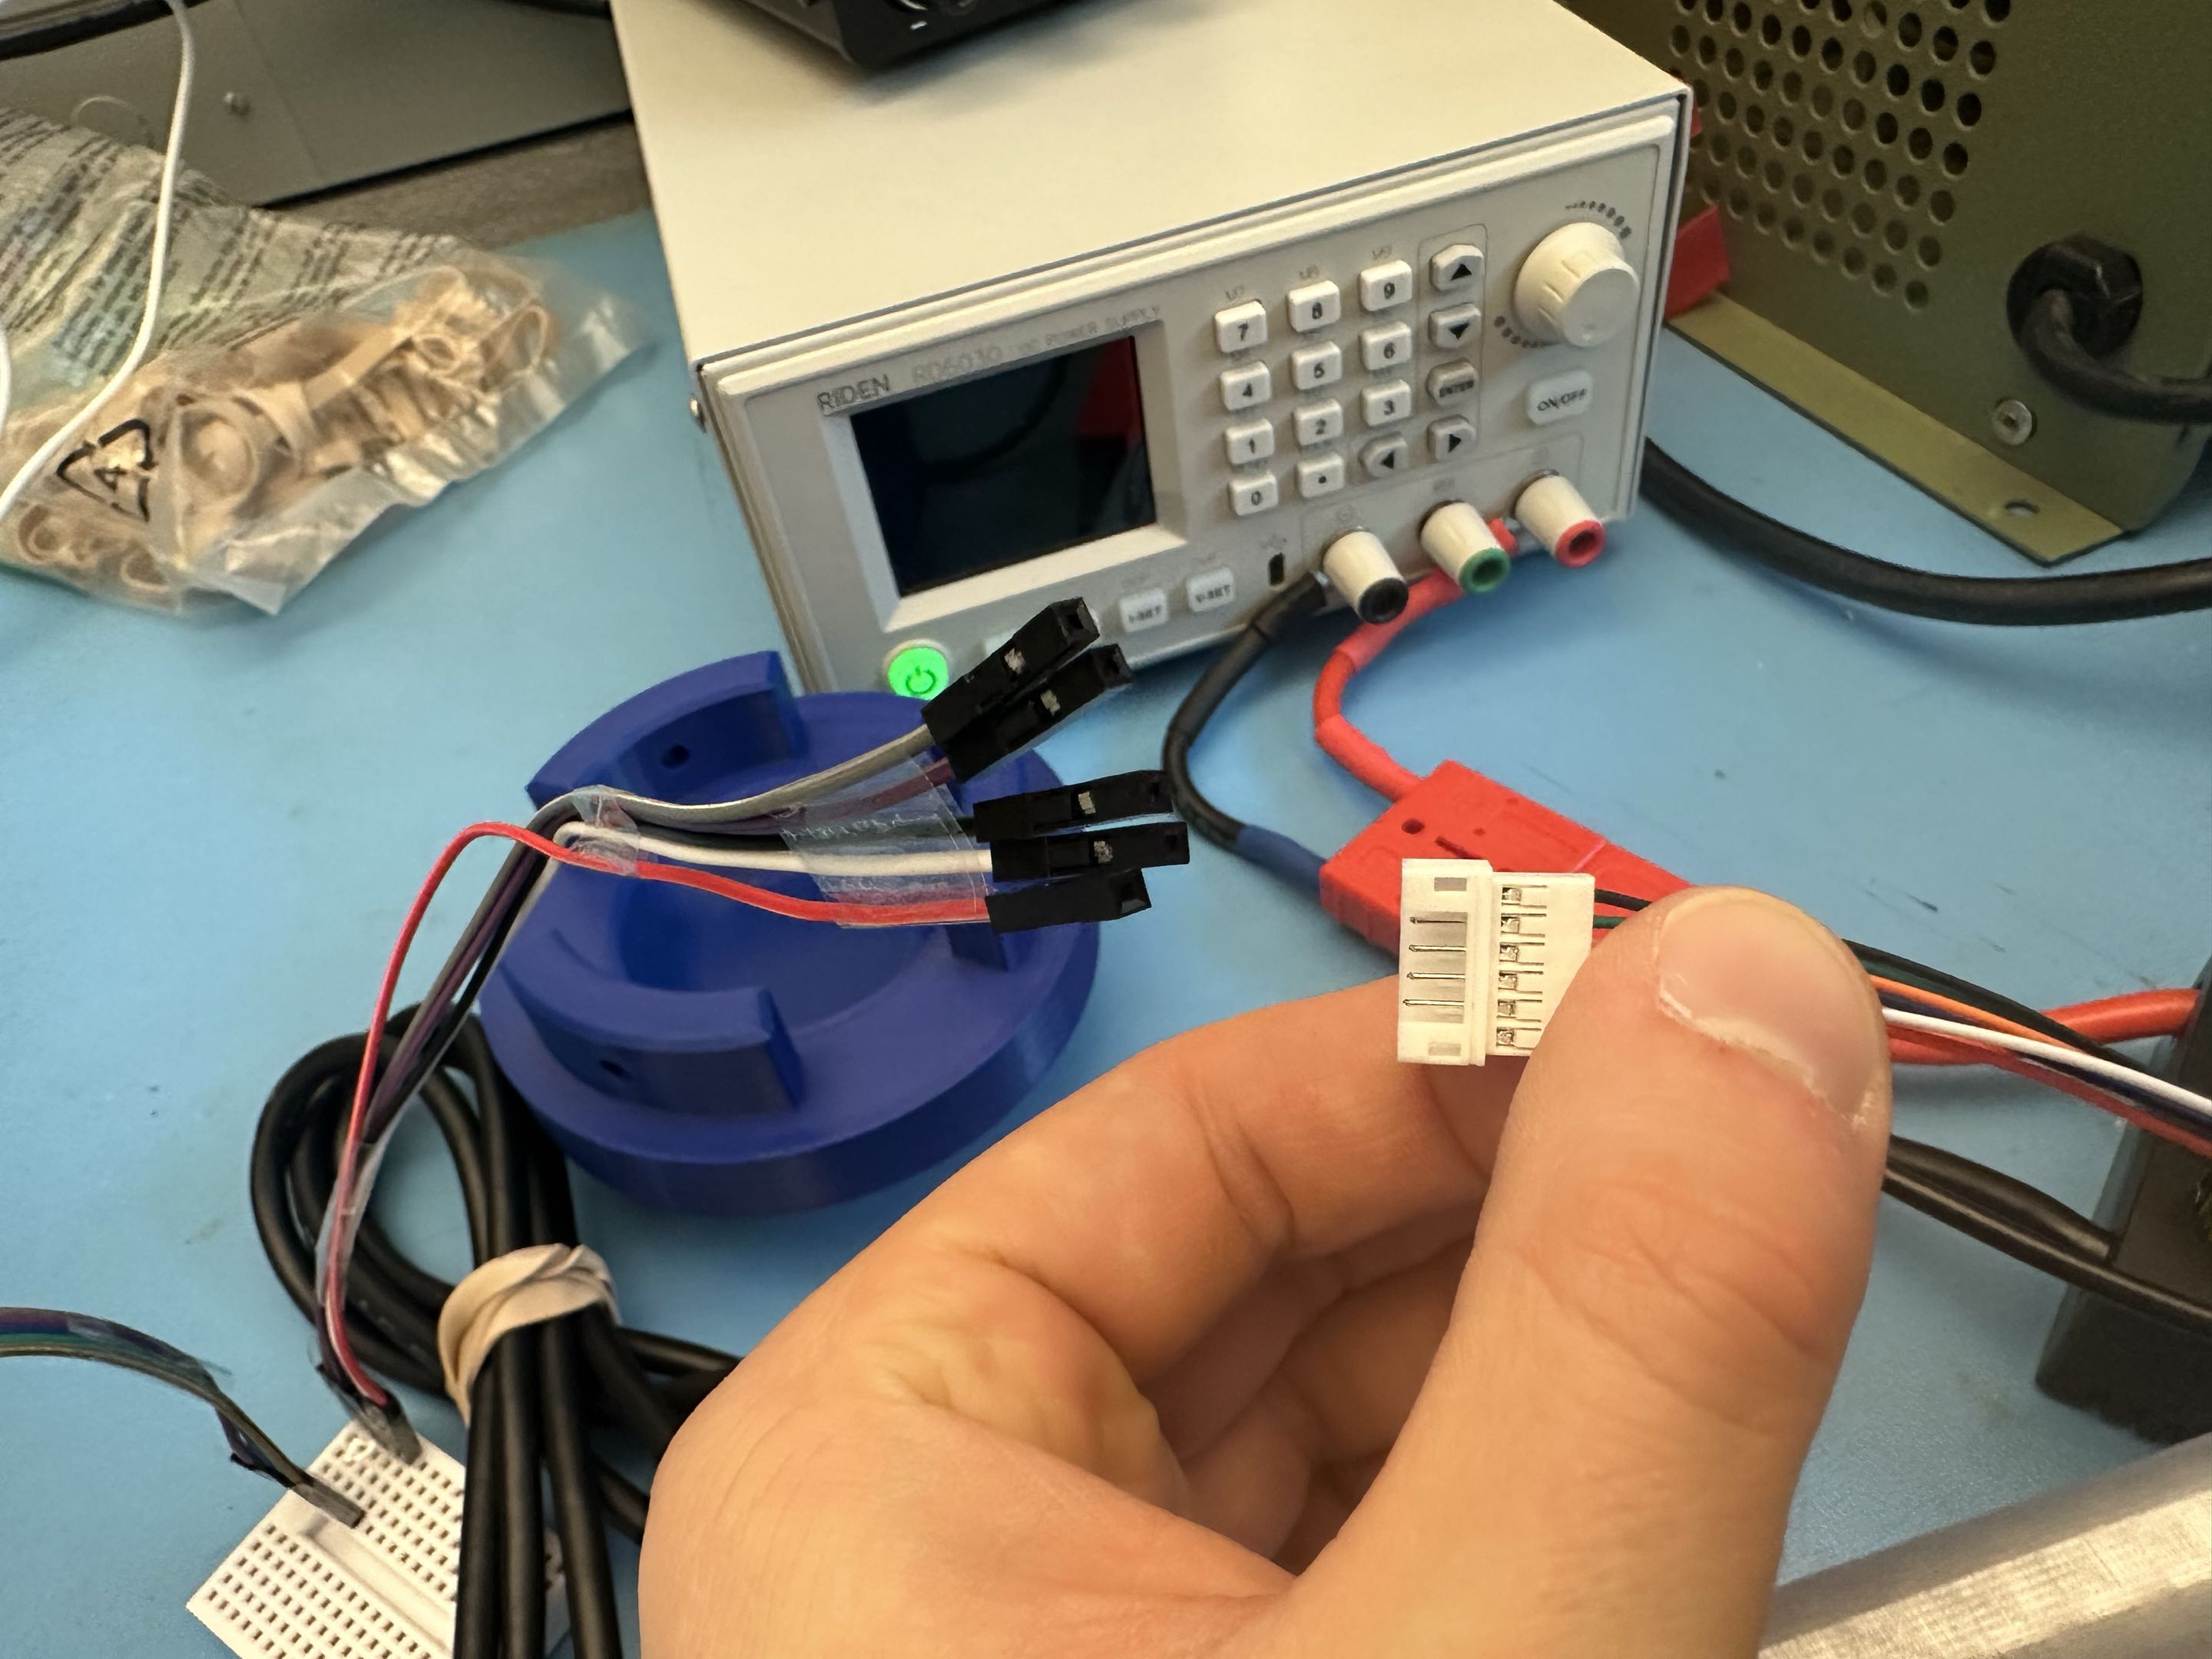
- Bench: Riden RD6030 55 V DC supply, YMC01 micro-ohm meter, clamp DMM, USB + BLE telemetry
Methodology
Every result is tagged to a configuration ID that fixes the controller, sensor mode, and mechanical setup:
- ODR-ENC: ODrive 3.6 + AMT-102 encoder (sensored, 0 RPM start capable)
- VESC-SL: VESC 75200 sensorless (observer works badly at low speeds / high starting inertia)
- VESC-ENC: VESC 75200 + AMT-102 encoder (in process of debugging why this isn't working)
Mechanical configs orthogonal: BARE, GEAR (+ 5:1 gearbox), H2 (+ gearbox + flywheel). A result reported as VESC-SL / GEAR is not interchangeable with ODR-ENC / BARE, and the differences are documented upfront in the Test Setup Log rather than buried in footnotes.
Tests follow a dependency graph: static, no-load dynamic, spin-up sanity, flywheel inertia, coast-down characterization, loaded dyno. Each test either stands alone or explicitly consumes a parameter from an earlier test.
Tooling
Every test is scripted. Custom Python drives the ODrive (odrive_sweep.py, odrive_rotor_inertia.py, odrive_kv_verify.py), and odrive_safe_startup.py validates bus voltage and motor parameters before energising the power stage so a future cal cycle cannot repeat the M0 failure. The VESC side uses a hand-built CLI for remote duty and current commands, plus on-MCU LispBM scripts that log Iq, velocity, and FET temperature at the control-loop rate. That was the only path that got COMM_LOG packets through reliably after VESC Tool 6.06 was identified as a silent packet-dropper; VESC Tool 7.00 is the working version.
Configuration state is tracked separately from data. The Test Setup Log freezes the exact controller, sensor, and mechanical configuration for every run, and the Motor Test Matrix tracks the dependency graph and status across runs. A result without a matching entry in both is not considered closed.
Test coverage at a glance
| # | Test | Status | Key result or gate |
|---|---|---|---|
| 1 | Static parameters | Done | R, L, pole pairs, winding confirmed across both controllers |
| 2.1 | Back-EMF / Kt | Done | 0.0551 / 0.0558 Nm/A (ODR / VESC), 1.3% cross-tool agreement |
| 2.2 | Kv verification | Done | 143.6 ± 0.7 RPM/V over 5 points |
| 2.3 | Cogging breakaway | Done (VESC-ENC re-run pending) | 1.9 A sensored vs 2.75 A sensorless = 0.85 A observer overhead |
| 2.4 | Friction model | Done | Tc/J 167 after new casing, 45% drop from V1 |
| 2.5 | Rotor inertia | Done | J = 170 to 175 g·mm² at 3 A |
| 2.6 | Step response (no load) | Done on ODrive | Bare and gearbox closed; VESC-ENC version pending |
| 3 | H2 spin-up sanity | Done | 10 runs, 7.5 t/s max before FOC desync and coupling slip |
| 4 | Flywheel inertia | Plan written, blocked | J through gearbox + freehub is not identifiable; isolation plan written |
| 5 | Coast-down characterization | Not started | Blocked on test 4 |
| 6 | Inertia dyno spin-up | Not started | Blocked on tests 4 and 5 |
| 7 | Efficiency and Kv under load | Not started | Post-processing on test 6 data |
| 8 | Gearbox efficiency | Not started | Needs test 6 baseline |
| 9.1 | Torque-speed curve | Partial | ODrive hit a 5 t/s PID ceiling; VESC expected to extend |
| 9.2 to 9.5 | Load / thermal / bandwidth | Not started | Needs sensored VESC + load instrumentation |
| 10 | Environmental durability | Not started | Production-validation stage |
Dependency graph
flowchart TD
    T1["Test 1<br/>Static<br/>DONE"] --> T2["Test 2<br/>Dynamic<br/>DONE"]
    T2 --> T3["Test 3<br/>H2 Spin-Up Sanity<br/>DONE"]
    T3 --> T4["Test 4<br/>Flywheel J<br/>PINCH POINT"]
    T4 --> T5["Test 5<br/>Coast-Down"]
    T5 --> T6["Test 6<br/>Dyno Spin-Up"]
    T6 --> T7["Test 7<br/>Efficiency / Kv"]
    T6 --> T8["Test 8<br/>Gearbox Eff."]
    T1 -.-> T9["Test 9<br/>Load Testing<br/>PARTIAL"]
    T2 -.-> T9
    T9 --> T10["Test 10<br/>Environmental<br/>DEFERRED"]

    classDef done fill:#c8e6c9,stroke:#2e7d32,color:#1b5e20
    classDef pinch fill:#ffcdd2,stroke:#c62828,color:#b71c1c
    classDef partial fill:#fff9c4,stroke:#f9a825,color:#795548
    classDef future fill:#f5f5f5,stroke:#9e9e9e,color:#616161
    class T1,T2,T3 done
    class T4 pinch
    class T9 partial
    class T5,T6,T7,T8,T10 future
Test 4 is the current pinch point. Everything from test 5 onward depends on a cleanly identified flywheel inertia, which the current gearbox + freehub path does not provide.
Test 1: Static Parameters (done)
| Parameter | ODR-ENC | VESC-ENC |
|---|---|---|
| R | 50.2 mOhm (phase-to-phase) | 24.3 mOhm (per-phase) |
| L | 23.1 µH | 27.6 µH |
| Pole pairs | 7 | 7 |
| Winding | Star | Star |
The 2x apparent R gap is reporting convention, not a motor variation: line-to-line equals 2x per-phase for a Y-wound motor, so 2 × 24.3 = 48.6 mOhm sits within a few percent of 50.2 mOhm. The residual gap comes from the different detection methods used by each controller. Pole count confirmed by hand rotation. I'm guessing the difference from the cheap milliohm meter comes from the additional resistance from the bullet connections to the ESC internals.
Test 2: No-Load Dynamic (done)
Kt / Ke (torque constant)
| Config | Kt (Nm/A) |
|---|---|
| ODR-ENC | 0.0551 |
| VESC-ENC | 0.0558 |
Cross-tool agreement within 1.3%. This is a strong point of validation. These two independent controllers with different detection methods agree on the physically meaningful constant.
Kv verification
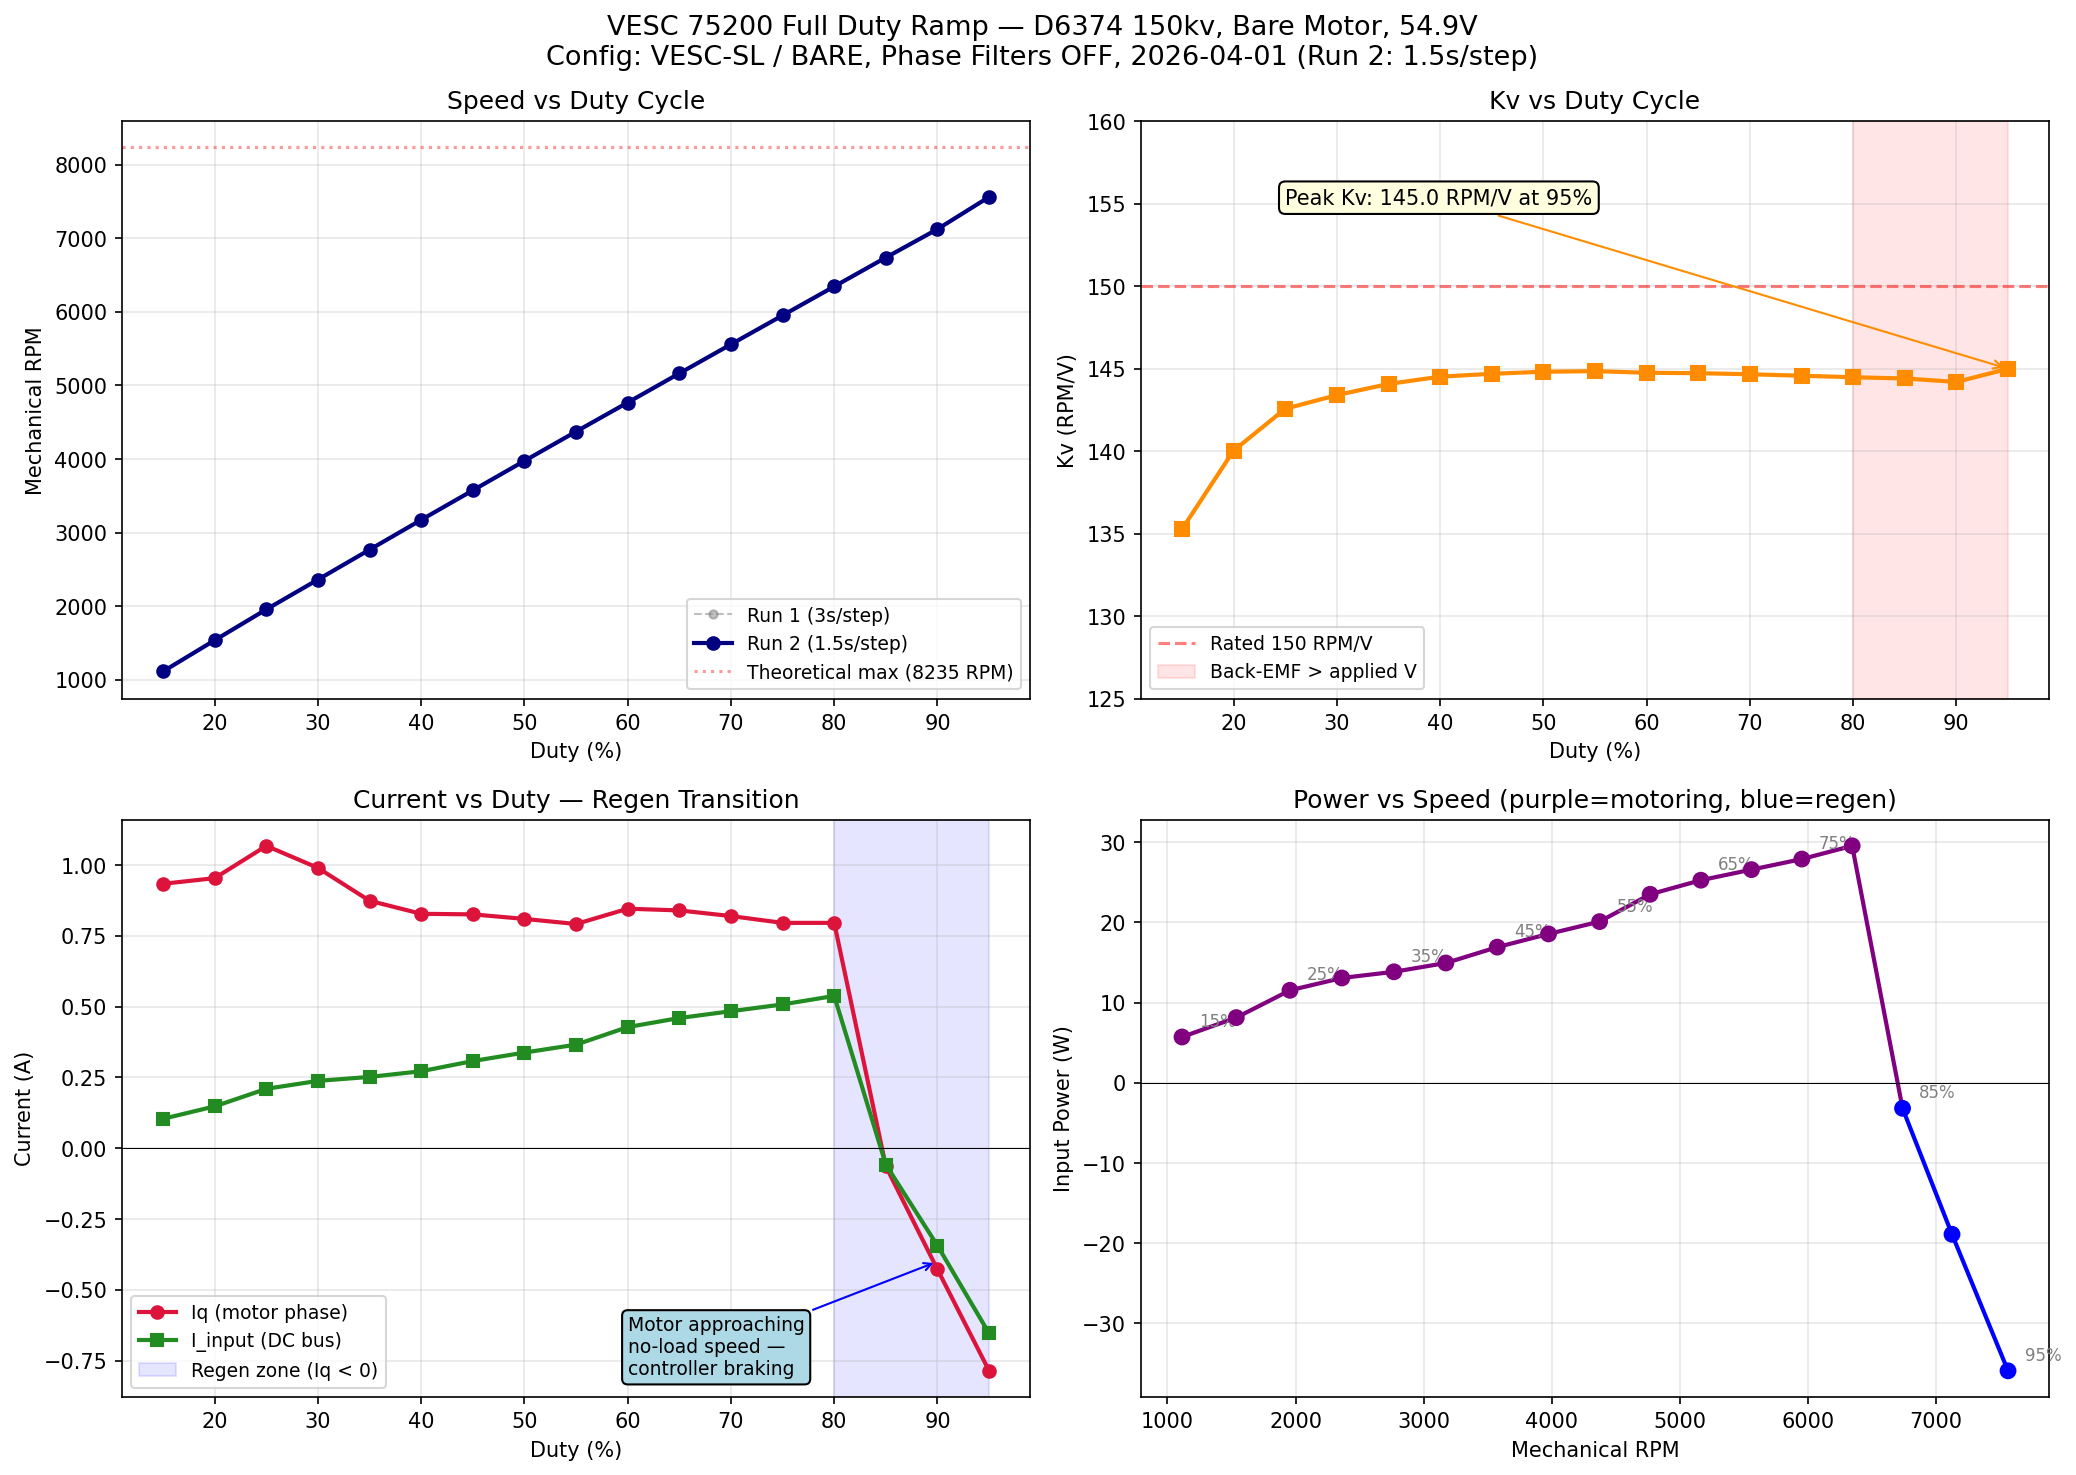
143.6 ± 0.7 RPM/V over 5 points, 4.3% below the datasheet rating of 150. Tight spread for bench conditions.
Cogging breakaway
| Config | Breakaway current |
|---|---|
| ODR-ENC | 1.9 A |
| VESC-SL | 2.75 A (range 2.2 to 3.2 A) |
The 0.85 A gap is not additional cogging. It is the sensorless observer spending current to locate the rotor from back-EMF. Running both configurations made that bias visible and quantifiable instead of mixed into a single number.
Planned plot: constant-torque vs back-EMF-limited torque-speed curve
A future addition to this section: the go-kart / EV style torque-speed plot that is flat in the constant-torque region at low speed and drops off linearly as back-EMF approaches bus voltage. Same plot ODrive publishes on their product pages.
Needed inputs: Test 6 (Inertia Dyno Spin-Up) data at multiple current levels, so the kink between constant-torque and back-EMF-limited regions shows up as a function of Iq. Blocked until the Test 4 pinch point clears.
Test 2.6: Step Response, No Load (done on ODrive)
Commanded velocity-loop step inputs on ODR-ENC, with and without the 5:1 gearbox, and logged encoder response. Two purposes: verify the controller tune, and expose how gearbox inertia and friction shift the effective closed-loop bandwidth.
Bare and gearbox configurations closed cleanly on ODrive. The VESC version is blocked until a VESC-ENC tune pass, because the sensorless observer cannot produce velocity feedback tight enough for a meaningful step trace. The ODrive position-control path also stopped here after the M0 driver damage described in Failures below.
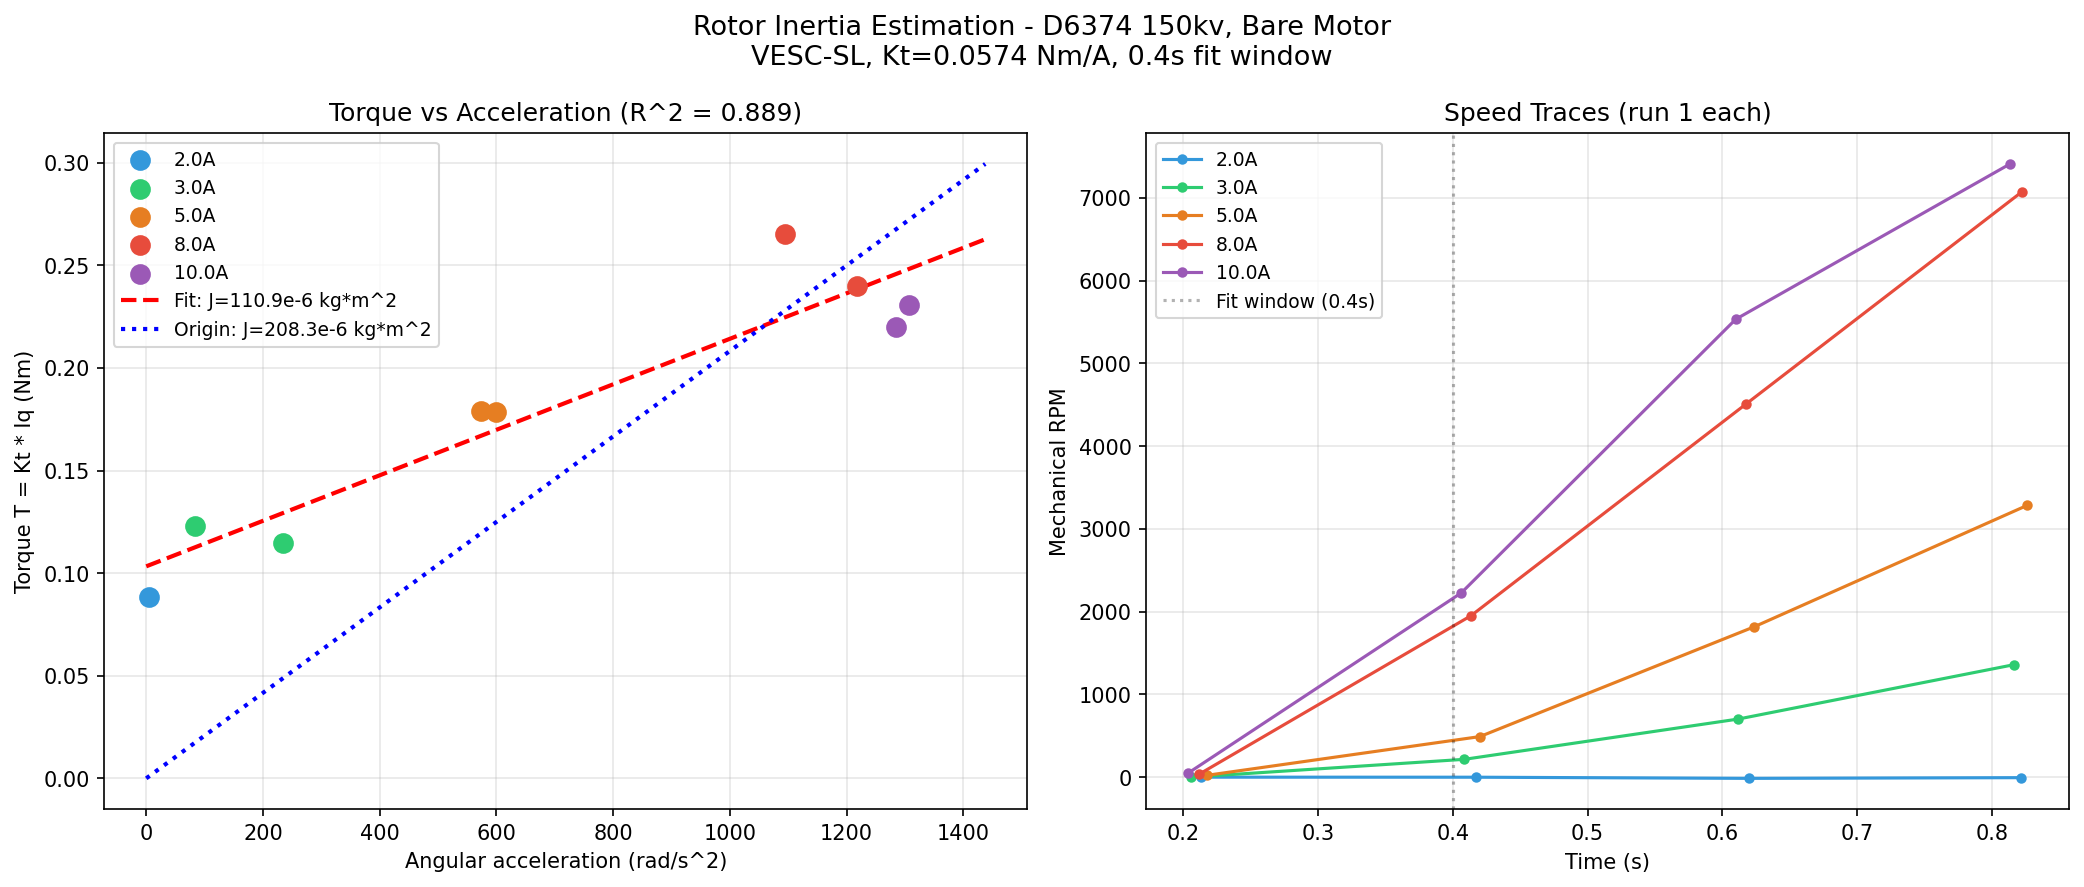
Test 2.4 / 2.5: Friction and Rotor Inertia (done, with a mechanical iteration)
Coast-down from regulated speed, fit to a Coulomb + viscous friction model, followed by multi-current inertia extraction.
The iteration. Initial casing had a rotor rub. Rebuilt the casing on 2026-04-10. Results after the rebuild:
- dropped from ~304 to 167 (~45% reduction in normalized Coulomb friction)
- settled at 0.602
- Run-to-run standard deviation dropped from 12.3 to 0.1 rad/s2, a ~100x repeatability improvement
Best rotor inertia estimate: = 170 to 175 g·mm² (at 3 A drive current).
How we actually pull J out of the data
The graph above is a fit to one ODE, not a direct inertia reading. Walk through the math:
Step 1. Write Newton's second law for the coasting rotor. With no drive current, the only torques are Coulomb friction (speed-independent, opposing motion) and viscous drag (proportional to speed):
Step 2. Solve the ODE. This is linear first-order. The closed-form solution is:
Fitting this curve to a measured coast-down trace gives two numbers: (Coulomb-to-inertia ratio) and (viscous time constant). That is what the plot below shows. But notice: neither , , nor appears by itself. We only get ratios. This is why a single coast-down cannot identify .
Step 3. Break the symmetry with a matched spin-up. Now drive the motor with known current . At the same instantaneous speed , write the spin-up equation:
And the coast-down equation at the same :
Step 4. Add them. The friction terms cancel:
No friction model needed. No assumption about how friction scales. The two matched accelerations do the work.
Result. Plugging in measured accelerations at and gives g·mm². Full procedure and validation checks in the Inertia Isolation Test Plan.
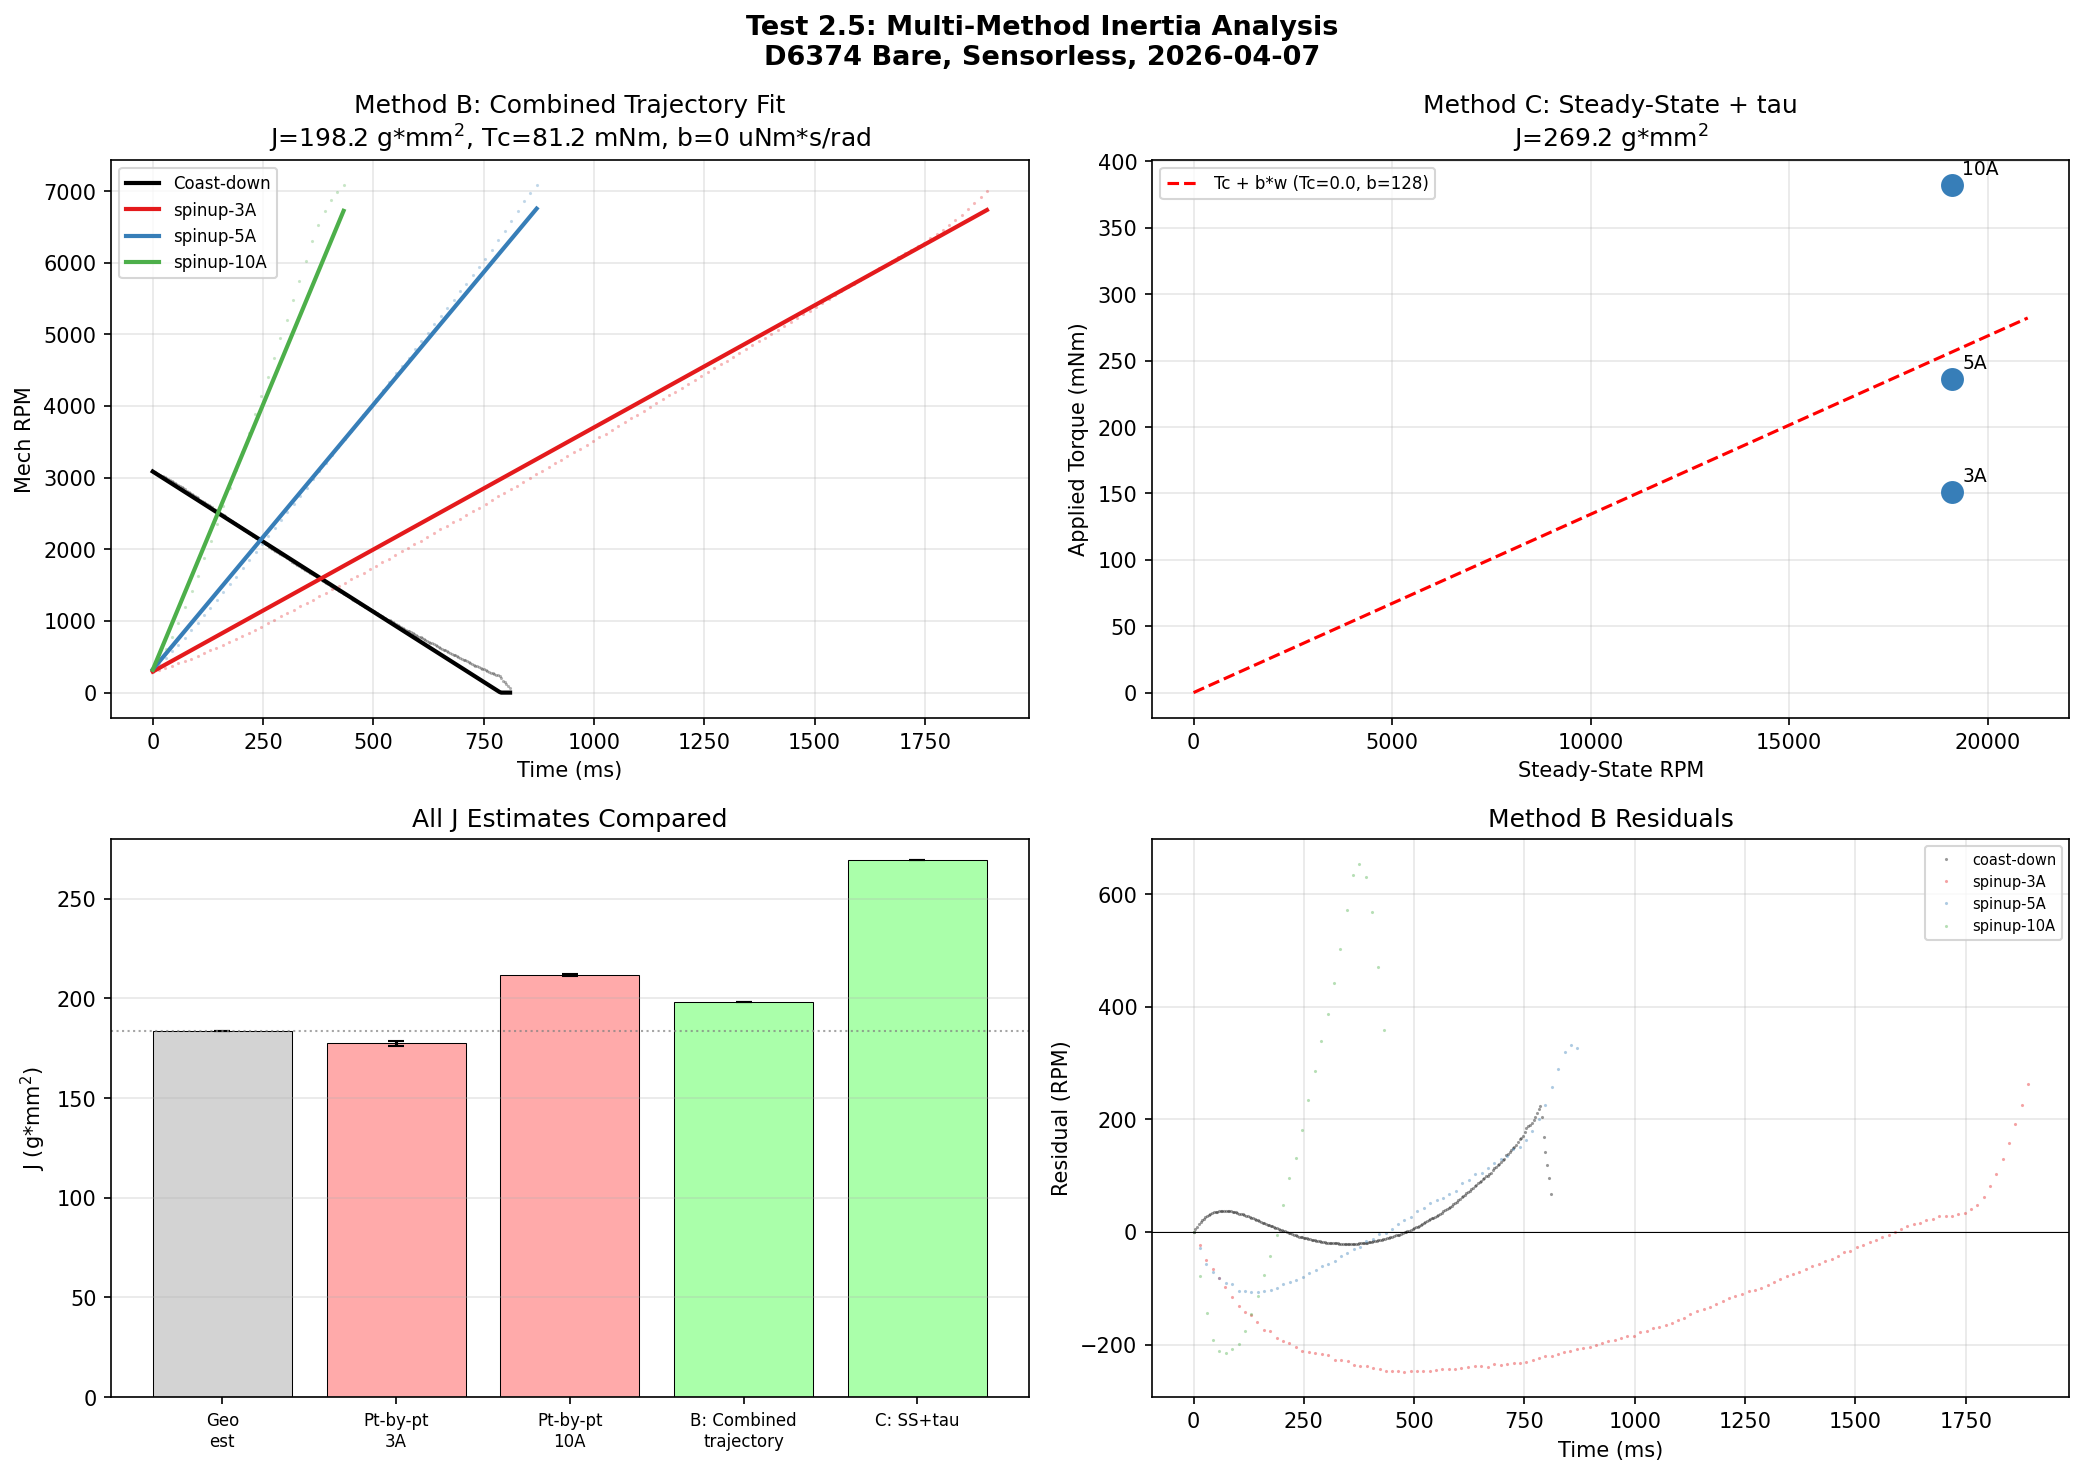
The drift
The multi-current inertia drift that had shown up in earlier sweeps did not change after the friction fix. That ruled out a mechanical cause and pointed at Iq telemetry bias from the controller instead, which is the direction future work continues. Full discussion in Cross-Cutting Findings #3.
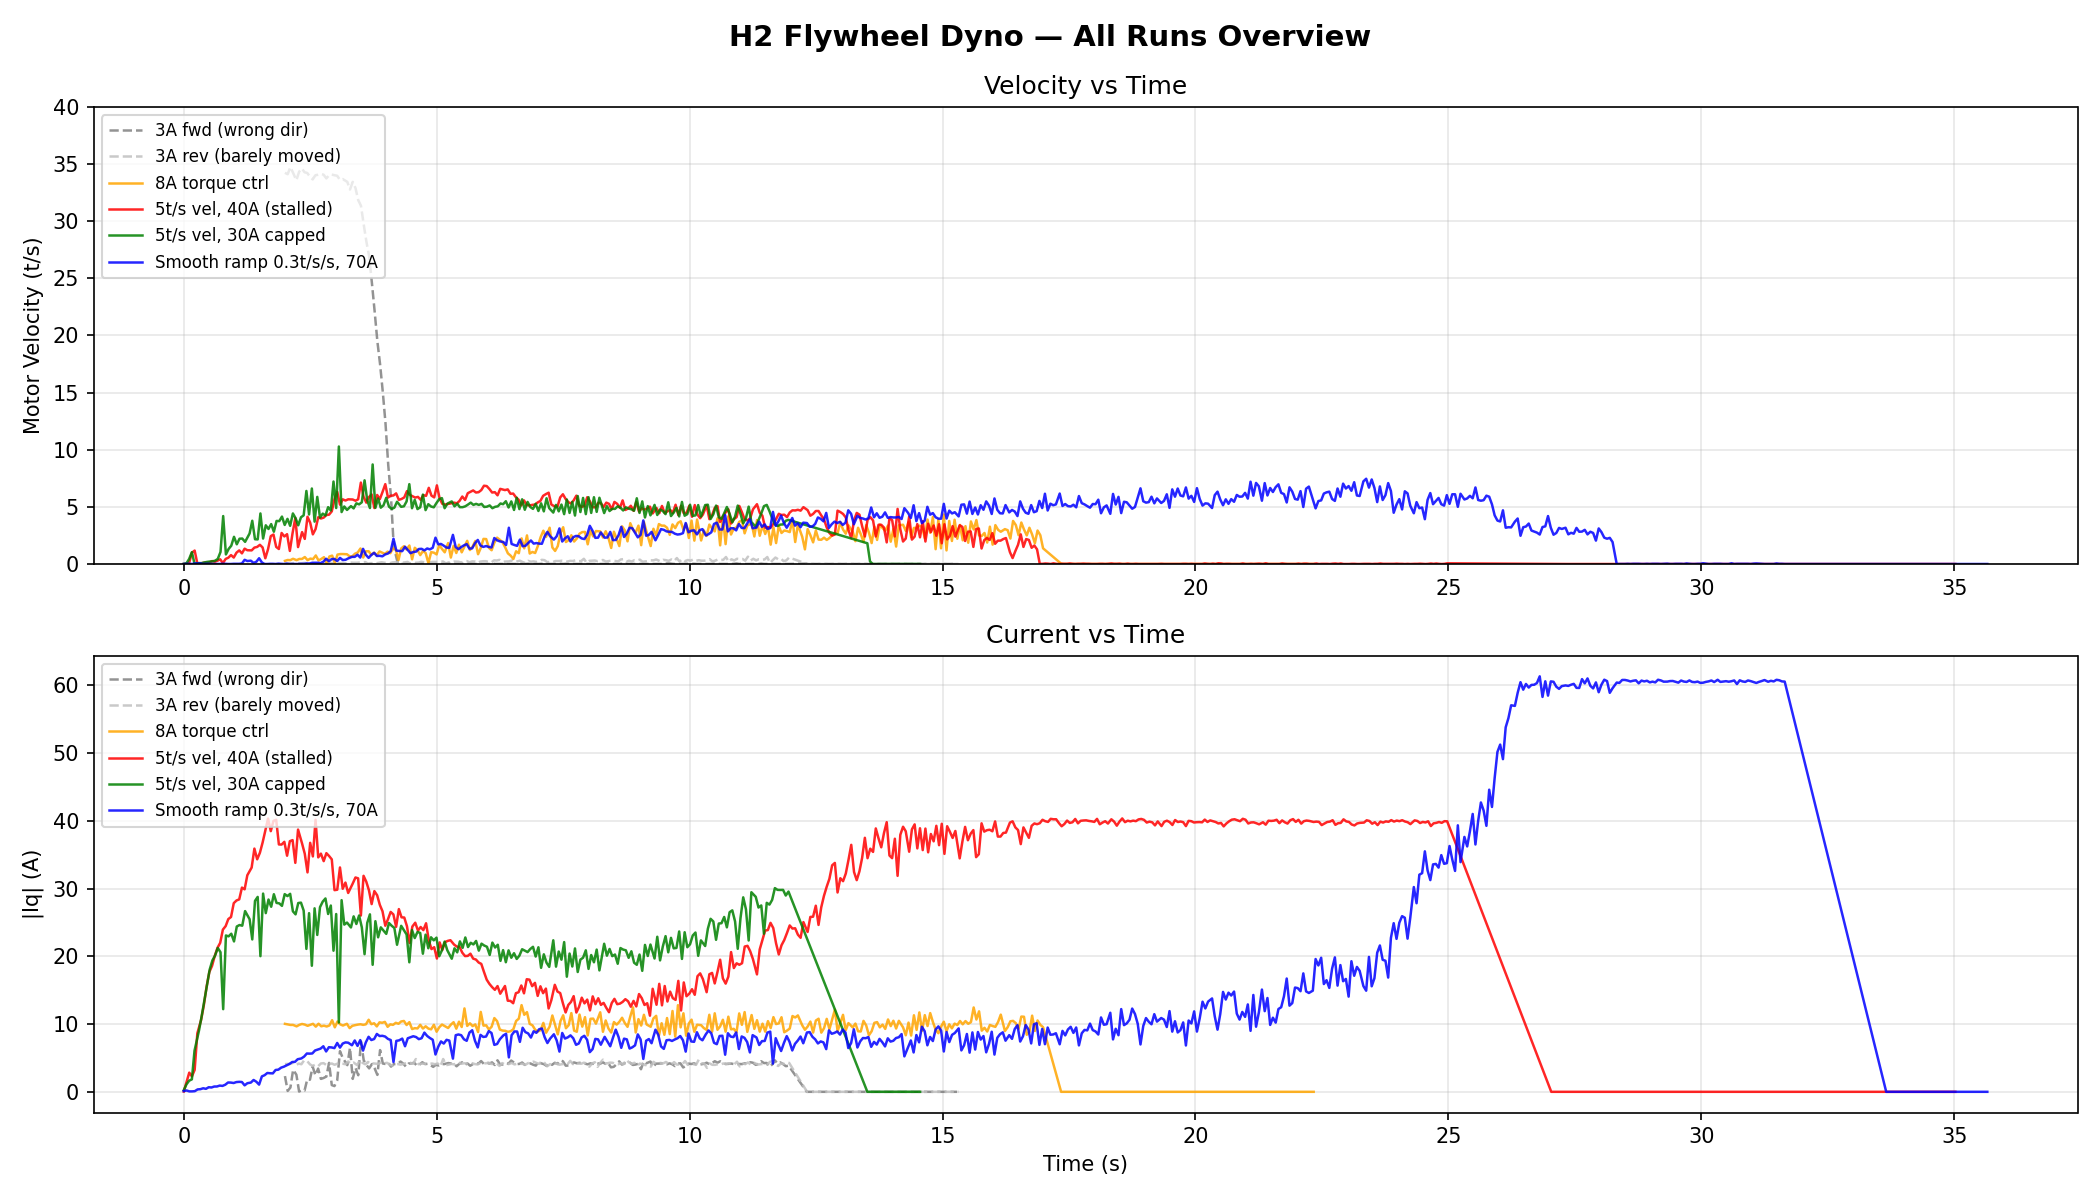
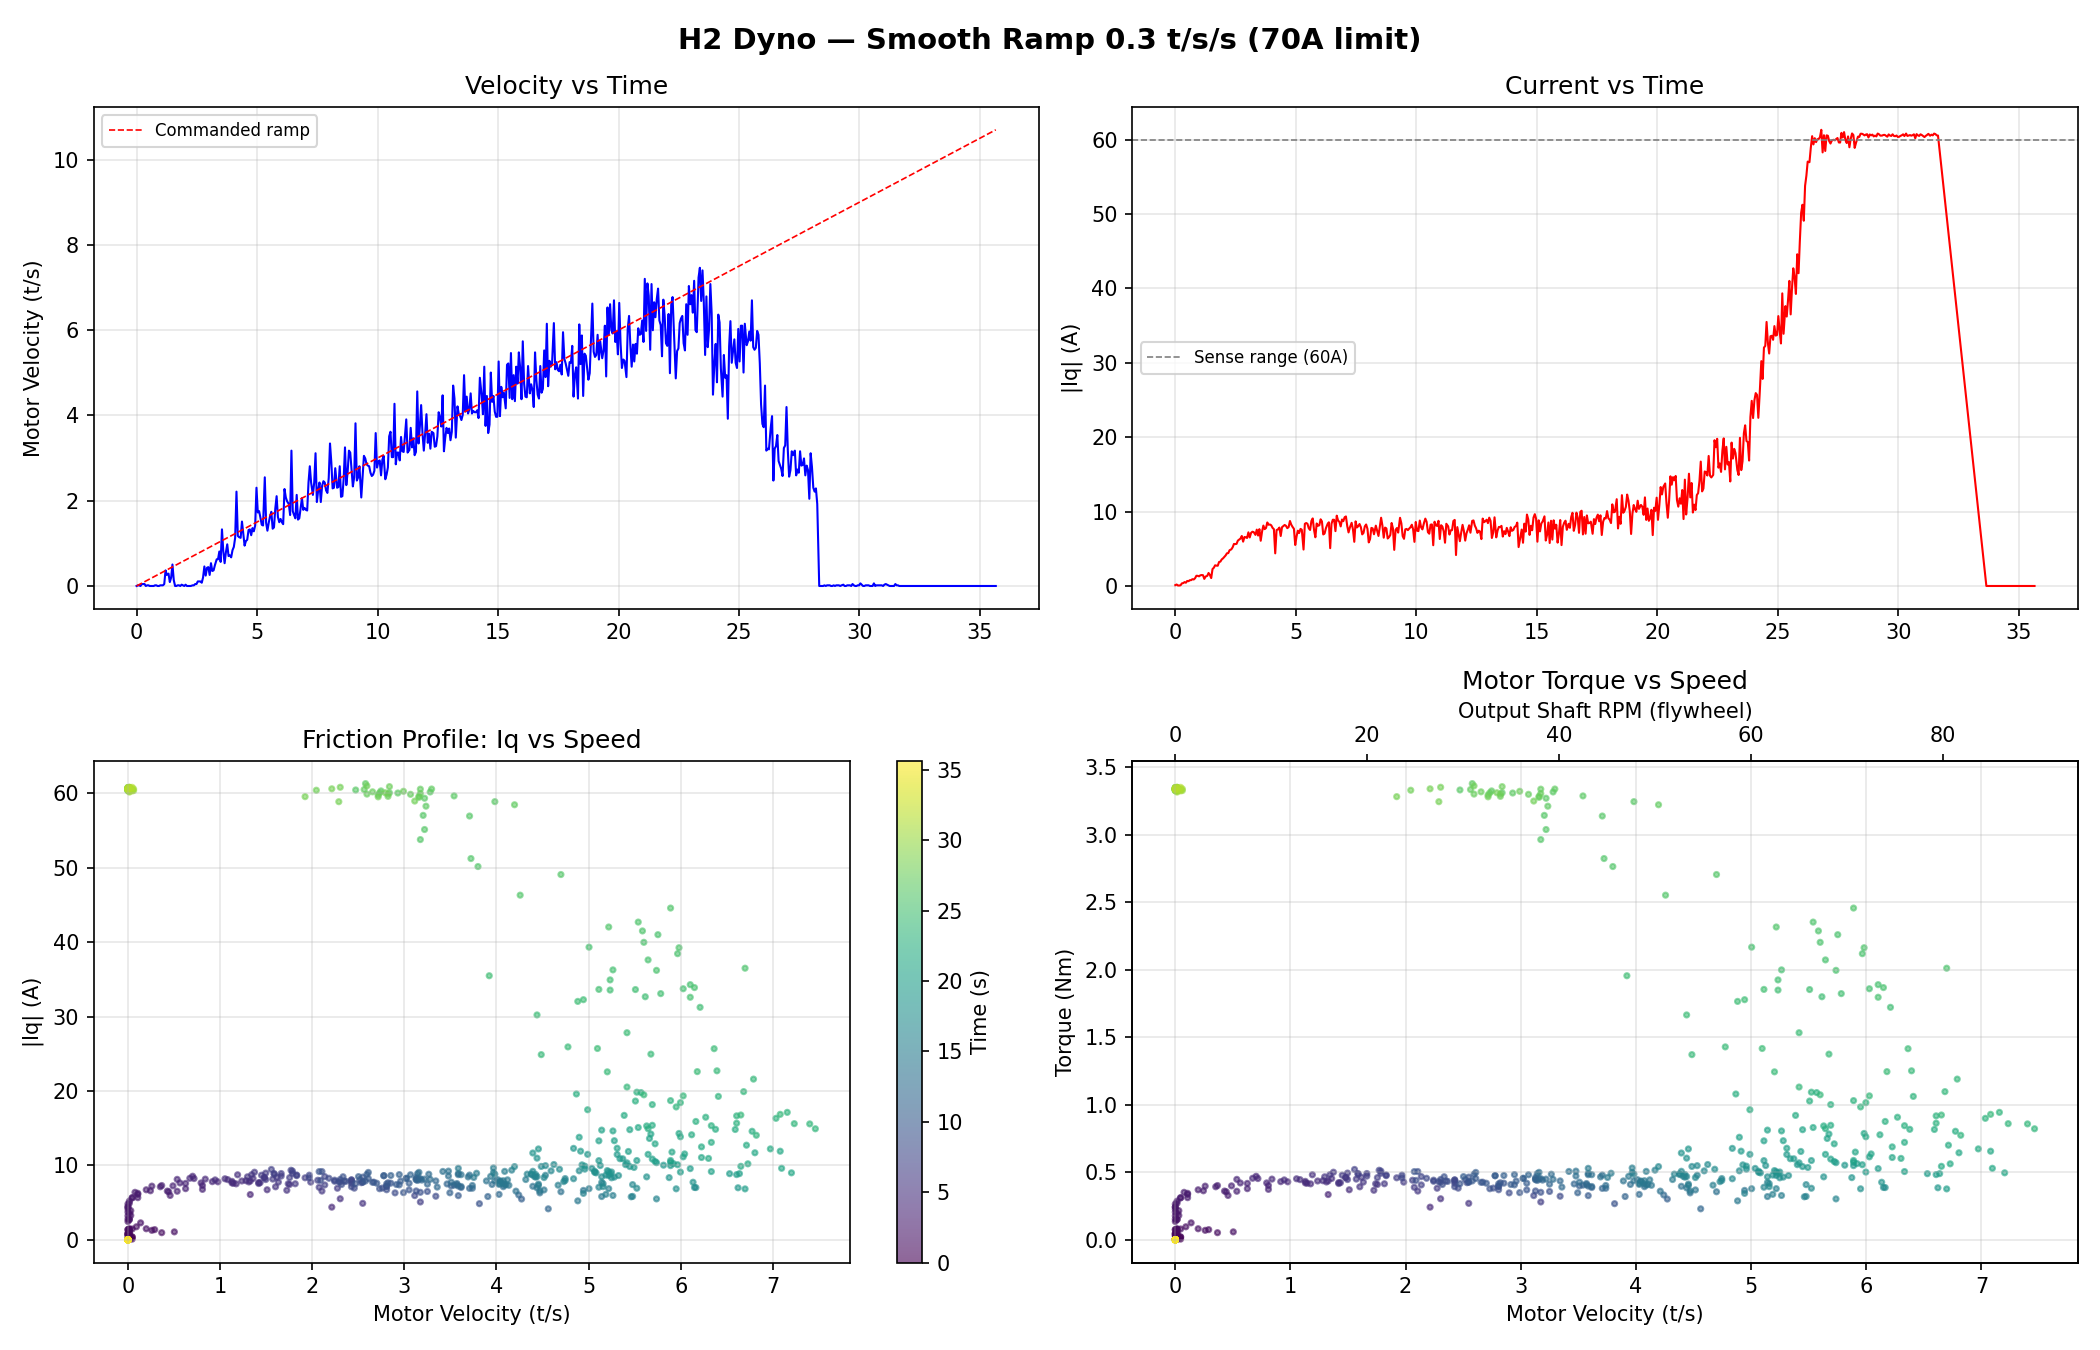
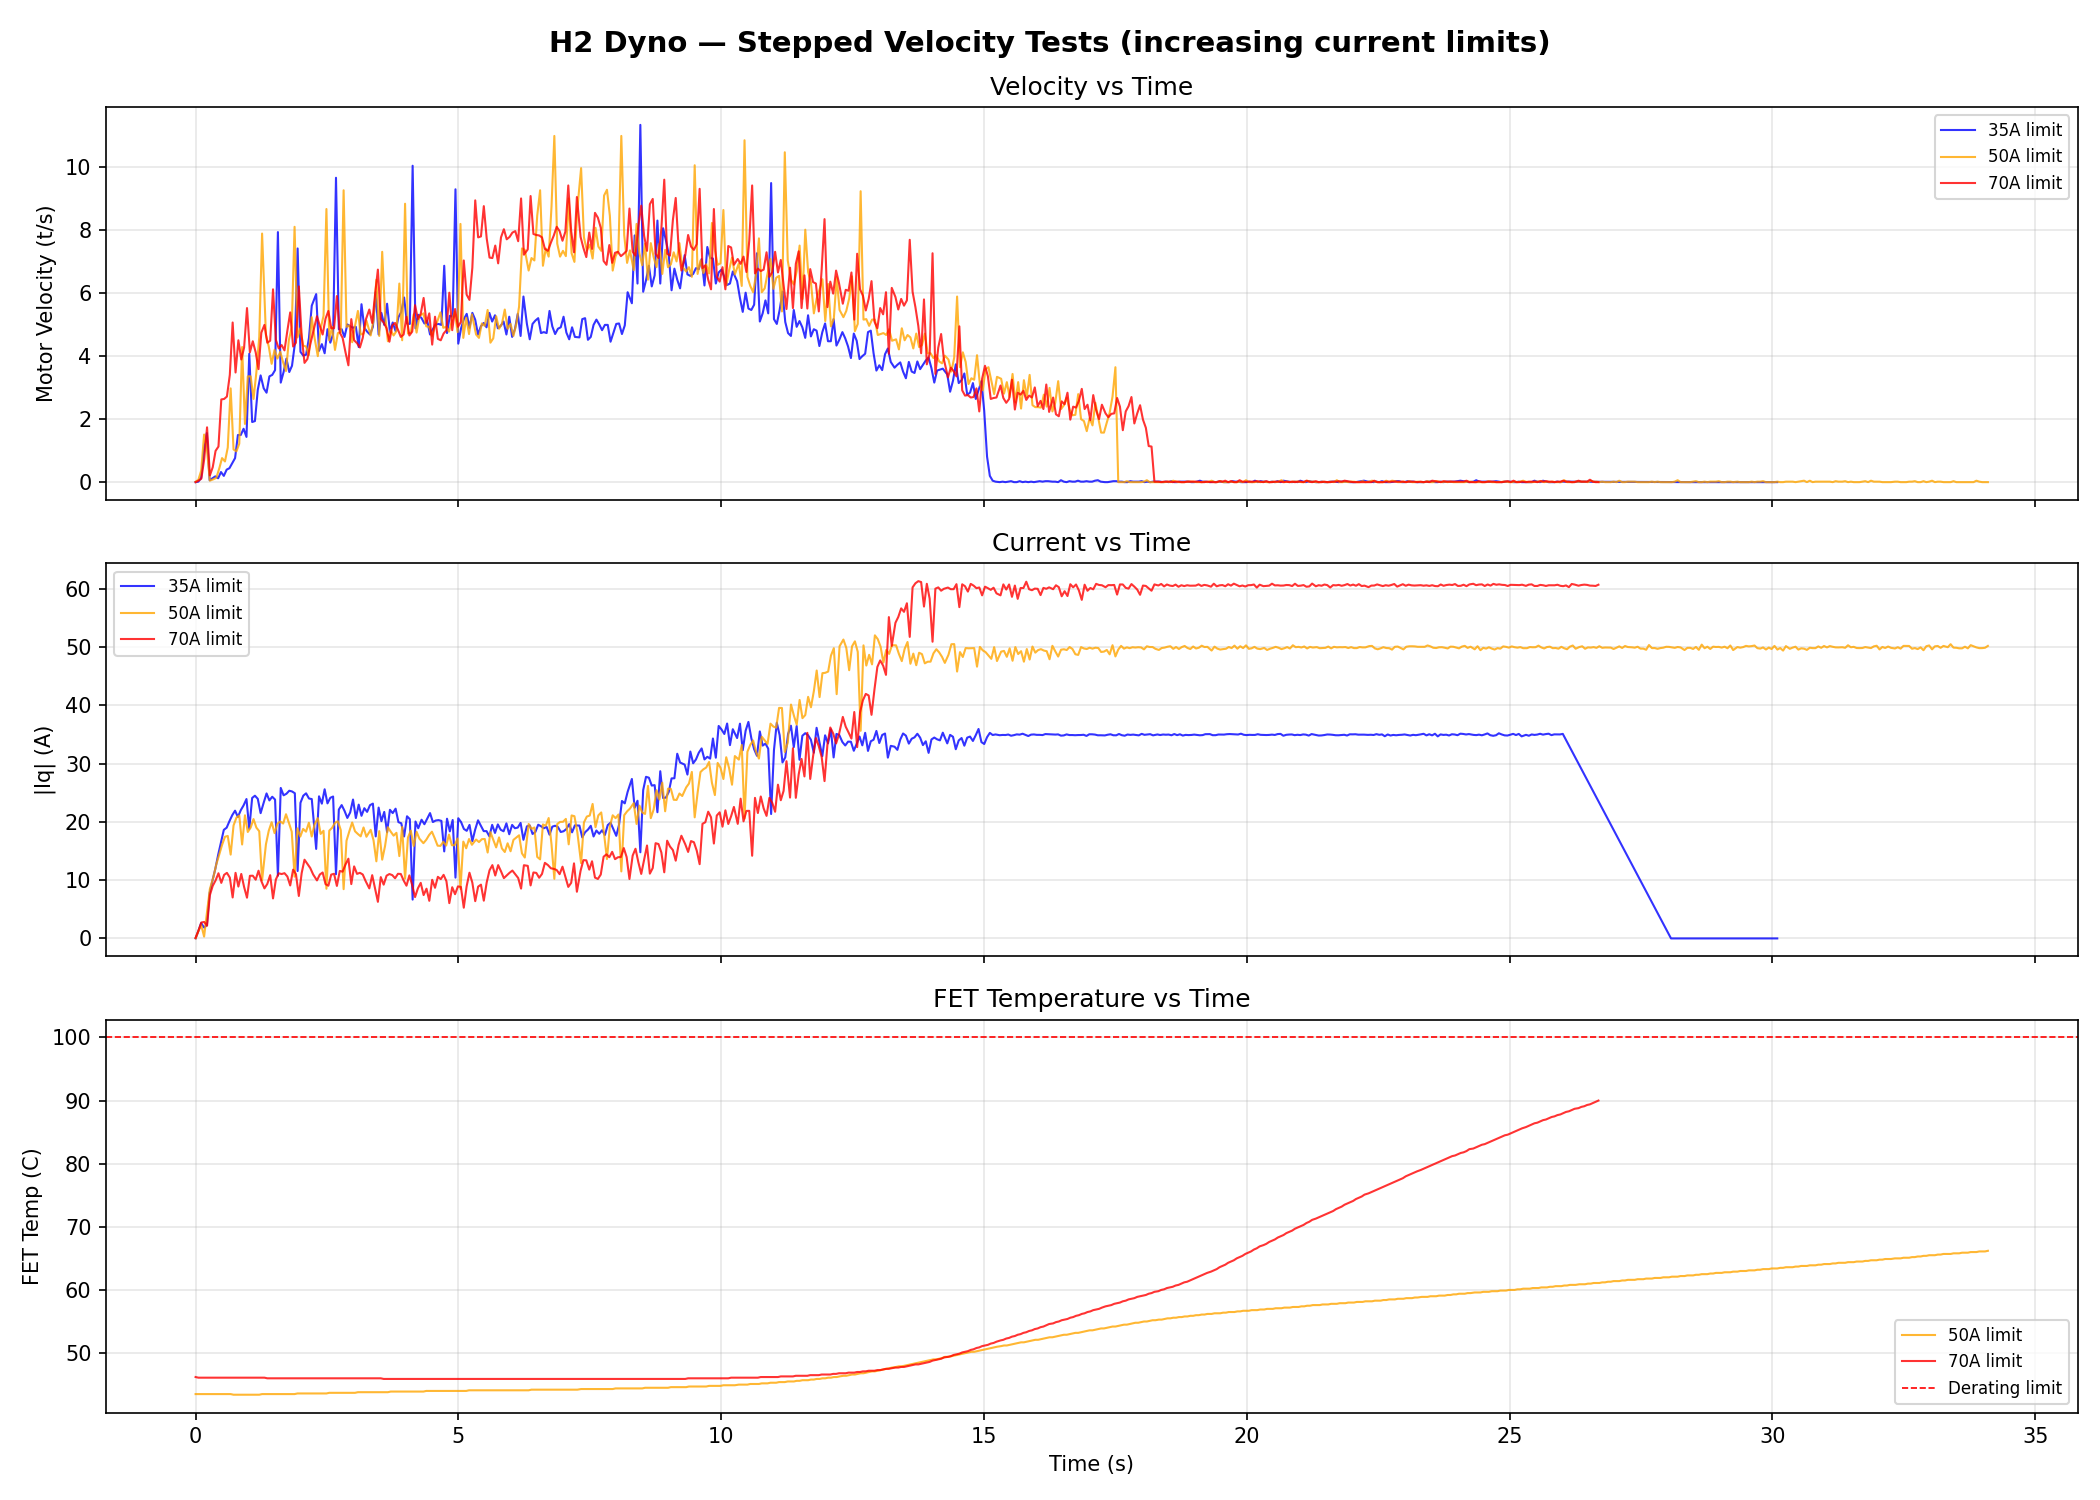
Test 3: H2 Flywheel Spin-Up (done, with constraints)
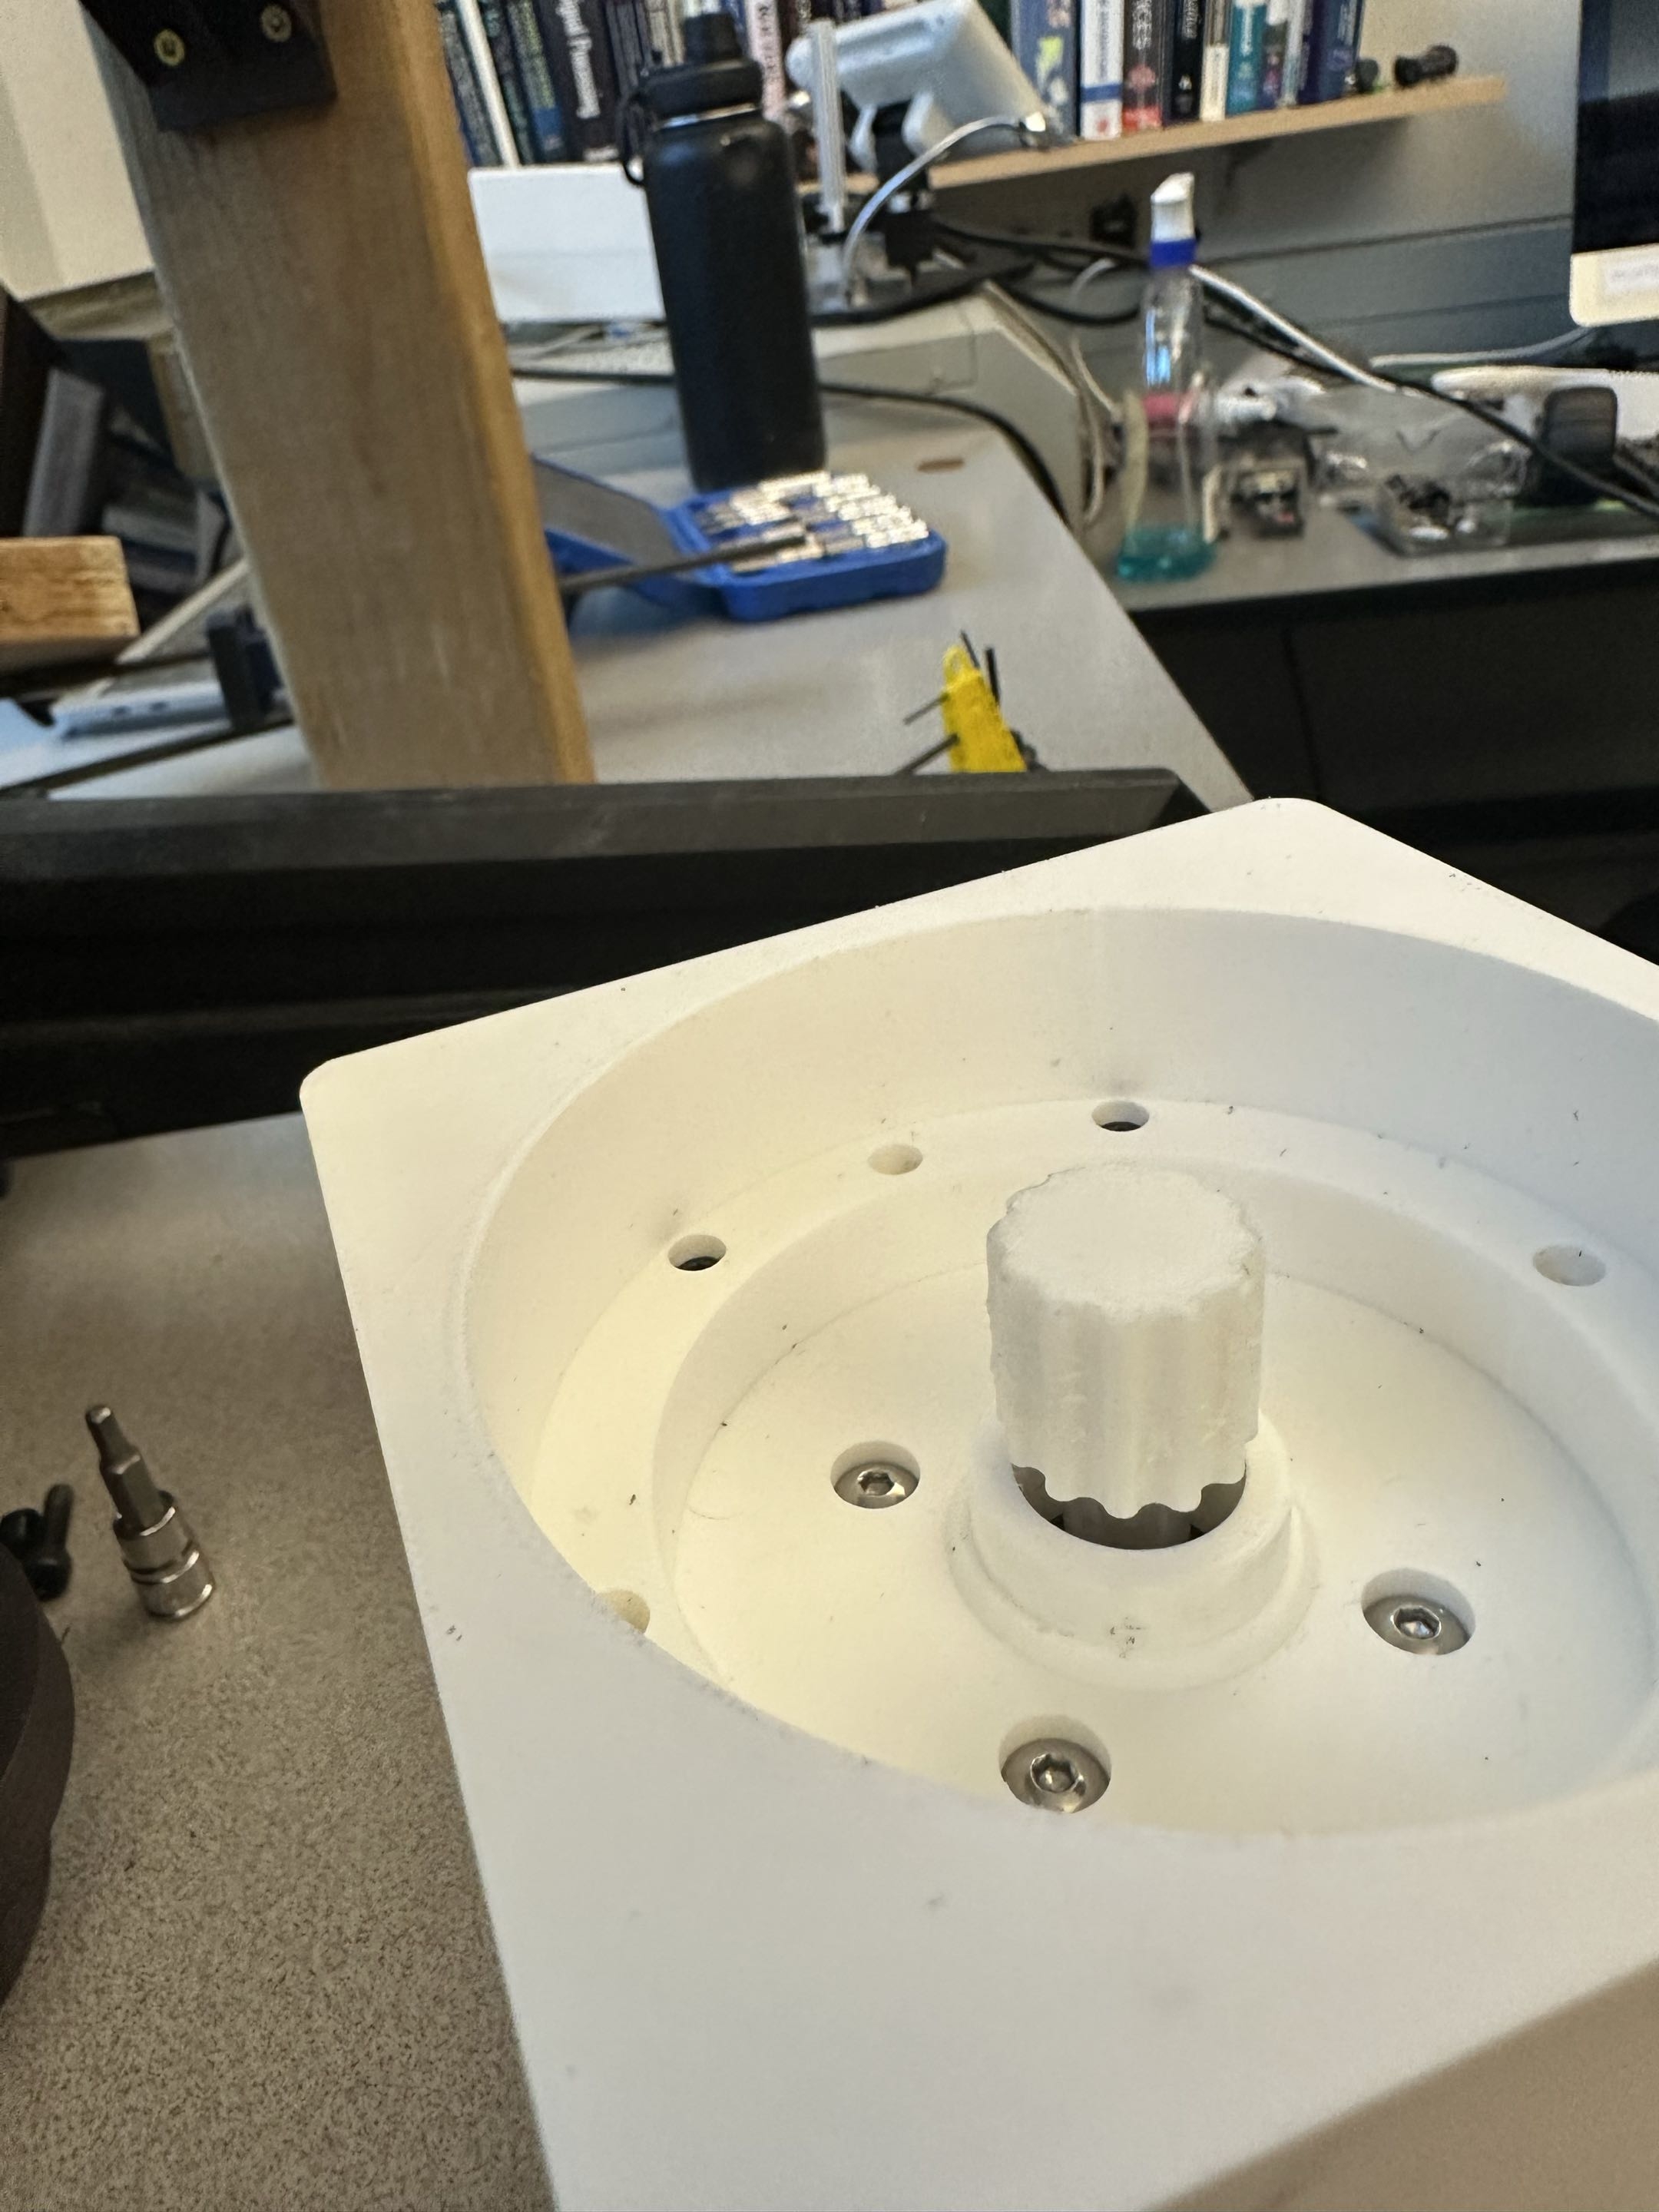
Saris Hammer H2 bike trainer repurposed as an inertia dyno: ~9 kg flywheel + eddy-current brake, BLE telemetry at ~1.1 Hz. Motor drives the flywheel through the gearbox and a one-way freehub, which means spin-up is motor data and coast-down is drag-only data. There is no steady-state loaded operating point through this path.
Max achieved: 7.5 t/s motor shaft (~450 RPM), before the ODrive FOC desync soft ceiling at ~50 t/s mechanical (350 electrical Hz against the 8 kHz current loop).
Field workaround. Winding temperature was read by clipping a DMM across the motor thermistor leads and manually converting voltage to temperature through a lookup. Not a long-term instrumentation plan, but enough to protect the motor for the first campaign while a proper logging path is built.
Test 4: Flywheel Inertia (plan written, blocked)
The goal was to measure the H2 flywheel's moment of inertia so that later dyno torque extraction (test 6 onward) could use a known J. With the current drive path that turned out to be an identifiability problem, not a measurement problem:
- The one-way freehub means the motor only drives the flywheel in the positive direction; the motor cannot decelerate the flywheel directly for a clean powered-deceleration coast-down
- The 5:1 gearbox adds its own friction and inertia, and that contribution is not separable from the flywheel itself through the current coupling
The decision was to stop and write an isolation plan rather than collect data that would fold motor, gearbox, freehub, and flywheel losses into one number. Two unblockers under consideration: direct drive with the flywheel replacing the freehub, or BLE-only coast-down of the flywheel alone after an external spin-up.
Why this has stalled
I accidentally fried the motor-driver IC on the ODrive board, which forced me onto the VESC. The VESC sensored mode has not worked despite many hours of debugging, so closed-loop encoder tests are currently blocked on either ESC. Plan after exam season is to get one of the two paths working: either replace the chip on the ODrive (or swap to a non-deprecated board like the ODrive Pro), or solve the VESC encoder mode directly. Full debugging log in Cross-Cutting Findings.
Written up in full as the Inertia Isolation Test Plan. Blocks tests 5, 6, 7, and 8 until resolved.
ODrive vs VESC
Two controllers, same motor. The point is not to pick a winner; it is to cross-validate and to give each test the controller best suited to it.
| Role | ODrive 3.6 | VESC 75200 |
|---|---|---|
| Current headroom | 19 A self-imposed safety ceiling (DRV8301 hardware goes higher; 19 A set after M0 FET failure) | 200 A hardware |
| Min reliable speed (sensorless) | n/a | ~400 RPM |
| Position control | yes | partial (VESC-ENC not working yet) |
| Telemetry depth | odrivetool Python | custom CLI + VESC Tool GUI + LispBM on-MCU |
| Best used for | fast sensored bring-up, Kv/Kt baseline, rotor inertia | high-current sweeps, encoder + sensorless contrast, thermal work |
Engineering lessons
Four that came out of the cross-controller structure and generalize beyond this motor:
- Config IDs paid for themselves. Tagging each result to
ODR-ENC / VESC-SL / VESC-ENCandBARE / GEAR / H2let the 0.85 A sensorless-observer overhead fall out as a clean delta instead of disappearing into run-to-run scatter. Without the tagging, the same data reads as noise. - A single-number Kt is a lie. Measured Kt dropped ~4% from 2.3 kRPM to 6.3 kRPM. Speed-proportional iron loss, not an observer artifact. Any Kt reported without an operating speed is already half wrong.
- Multi-current inertia drift was the telemetry, not the mechanics. Rotor J fits grew with Iq, and the drift stayed identical after a major friction rework. That ruled out a mechanical cause and pinned it on VESC Iq window-averaging. Low current is where the method stays honest, which is the opposite of the usual signal-to-noise intuition.
- The gearbox is not a passive modifier. Adding the 5:1 reduction changed the control problem, not just the gain schedule. A ramp rate that worked bare stalled the integrator through the reduction, and a separate 3D-printed coupling adapter added ~51% to the measured inertia on its own. Load-path geometry is part of the test, not a boundary condition.
Failures and Redesigns
Below are the three physical failures from the campaign. Controller-level tuning surprises from the same work are collected separately in the ODrive Tuning Discoveries (ODrive era) and Cross-Cutting Findings (VESC era) notes.
ODrive M0 FETs blown (2026-03-29)
Current limit raised during troubleshooting, power stage did not survive. The M0 gate driver IC shows visible chip damage consistent with either a phase short or pushing bus voltage too close to the device limit. This is the reason M1 is the only live motor port on the ODrive, why the 19 A ceiling is now a hard rule, and why loaded testing and position-control work migrated to the VESC. odrive_safe_startup.py was written so future cal cycles validate bus voltage and parameters before energising.
Next steps to bring the ODrive back:
- Order the replacement driver IC (DRV8301-family)
- Rework the M0 power stage on the bench soldering setup
- Bring M0 back online under the 19 A ceiling before trusting it
H2 coupling slip (2026-03-28)
Freehub interface loosened on higher-torque runs. Visible as the early knee on the smoother ramps in the H2 overlay. Captured as a fix item, not glossed over.
Gearbox V1 drag dominated the friction map
Once the new casing ruled out the rotor rub, the remaining friction story pointed at the reduction, not the motor. V1 was pulled and opened for teardown.
Status and Next
- Tests 1 (static) and 2 (no-load dynamic) closed
- Test 2.3 cogging still needs a VESC-ENC re-run to close the observer-overhead loop with direct sensor data
- Test 3 H2 spin-up sanity closed, 10 runs logged
- Test 4 flywheel inertia blocked: gearbox + one-way freehub makes flywheel J unidentifiable through the current path. The Inertia Isolation Test Plan is written; unblocks via direct-drive or BLE-only coast-down
- Tests 5 through 8 follow once test 4 clears
- Tests 9 (load) and 10 (environmental) are production-validation territory