One-line summary
I built traction, efficiency, and lap-time models to choose a final drive ratio that maximized competition points, then used that analysis to support a sprocket change and resolve competing subsystem priorities.
Opening
The final drive ratio looked like a simple top-speed tradeoff. It wasn't.
On a single-speed FSAE EV, one ratio touches acceleration, motor efficiency, top speed, packaging, chain forces, and differential torque at the same time. Different people were optimizing for different outcomes, and the default intuition was to bias toward top speed.
I wanted to answer the real question: what ratio actually makes the car faster in competition, without creating a drivetrain or efficiency problem elsewhere?
That meant turning a design-review argument into a vehicle-level decision problem with physics and scoring behind it.
The engineering problem
A single ratio had to satisfy four competing objectives at once:
| Objective | What it wants | Ratio direction |
|---|---|---|
| Traction-limited acceleration | Enough wheel torque to reach the tire limit | Higher |
| Motor efficiency | Stay in the high-efficiency operating region | Moderate |
| Top speed | More speed at the end of straights | Lower |
| Packaging and chain / diff loads | Lower transmitted torque and easier mechanical packaging | Lower |
That made this a cross-subsystem problem, not just a powertrain tuning choice.
The naive answer was to optimize for top speed. My analysis showed that was the wrong objective.
Governing principle
The core idea was simple: the car should be traction-limited, not motor-limited, in acceleration.
If the motor cannot generate enough wheel torque to reach the tire traction limit, the car is leaving acceleration on the table. Once the car is traction-limited, increasing the ratio further does not improve launch performance, so the problem becomes finding the lowest ratio that guarantees traction-limited acceleration without paying for it somewhere else.
This turned the whole question into a bounds problem:
- too low, and the motor is the bottleneck
- high enough, and the tires become the bottleneck
- too high, and efficiency starts to fall without a meaningful points return
How I answered it
I built three main analysis paths that all converged on the same answer.
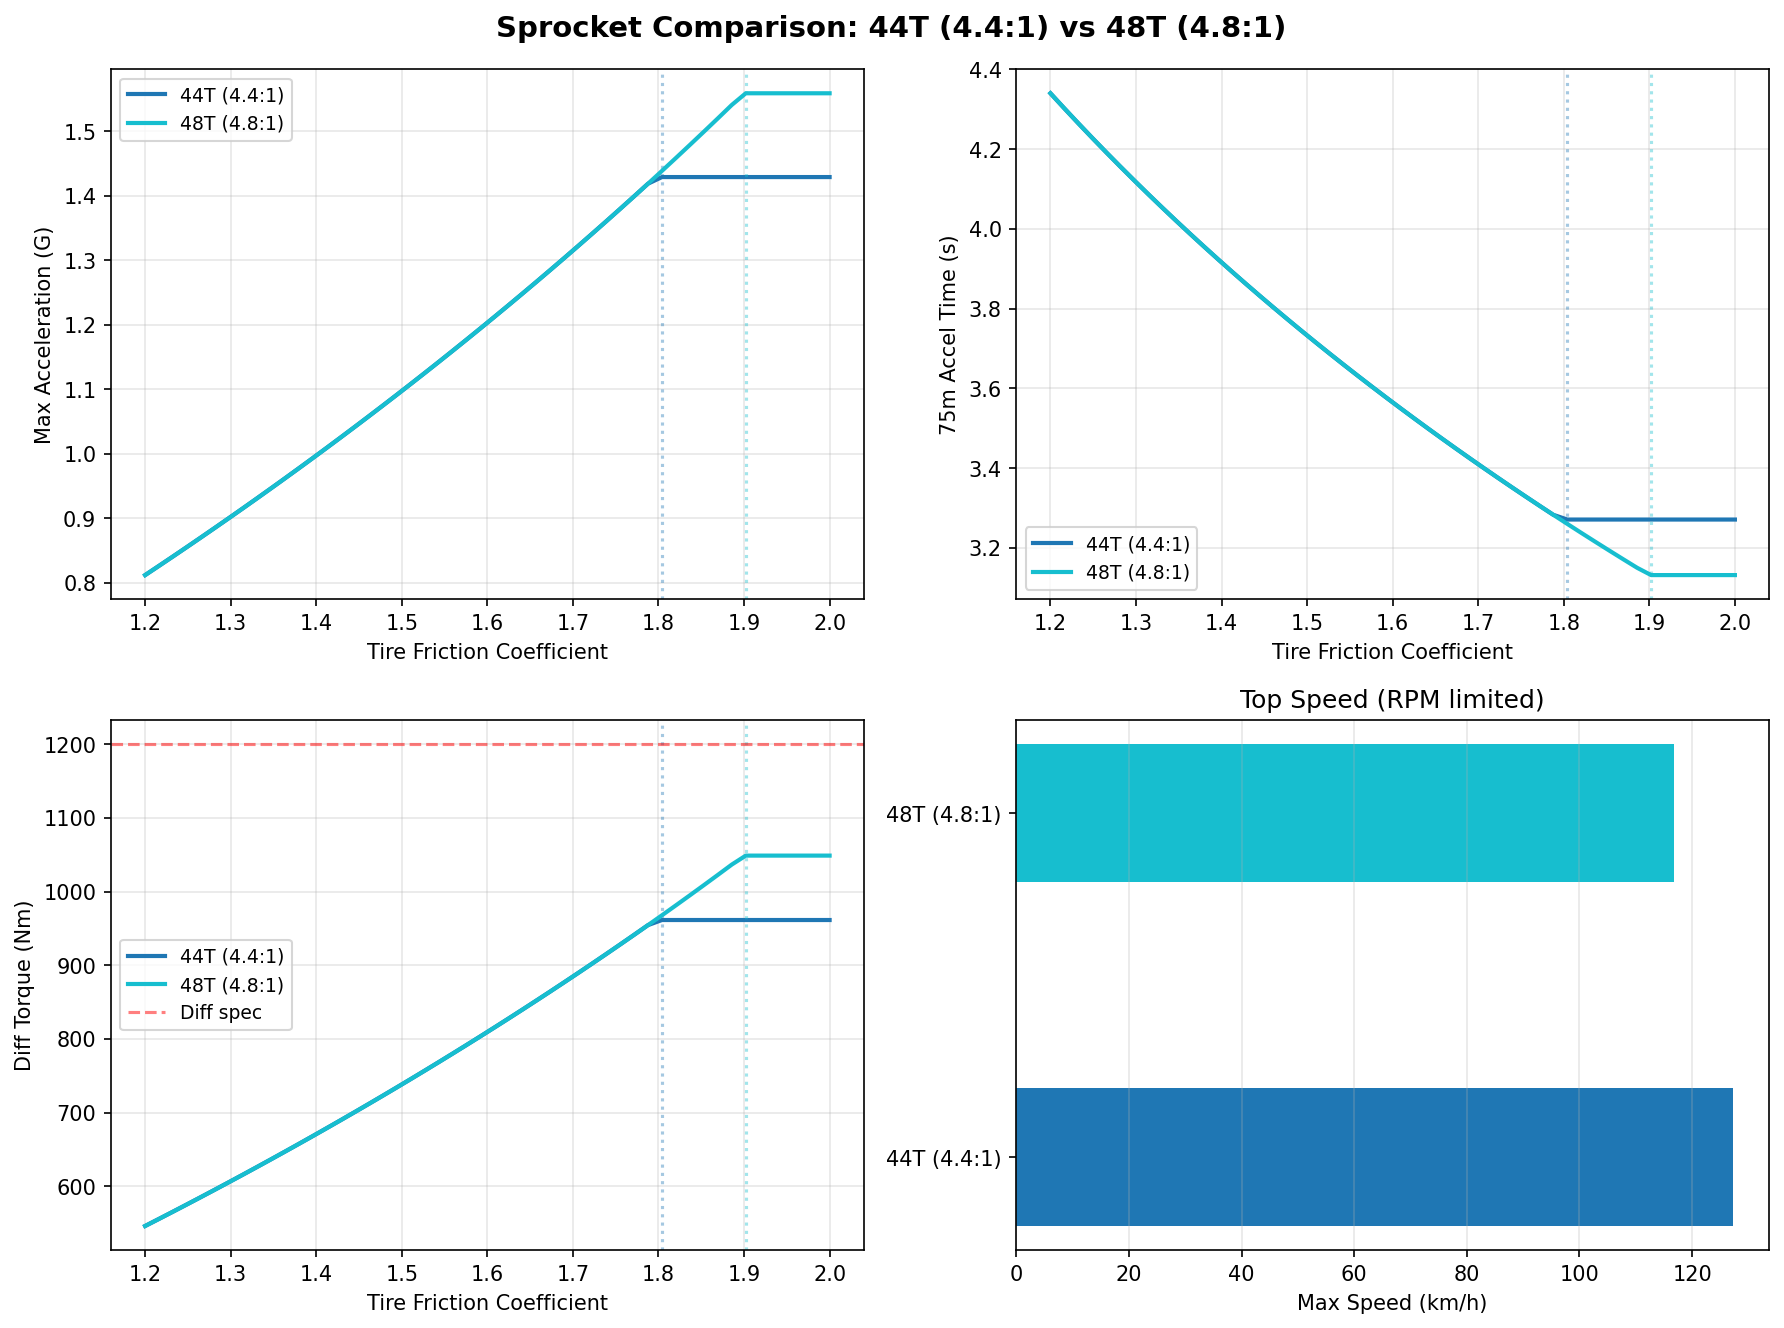
1. Traction and differential torque model
The first question was whether a more aggressive final drive would overload the differential or chain.
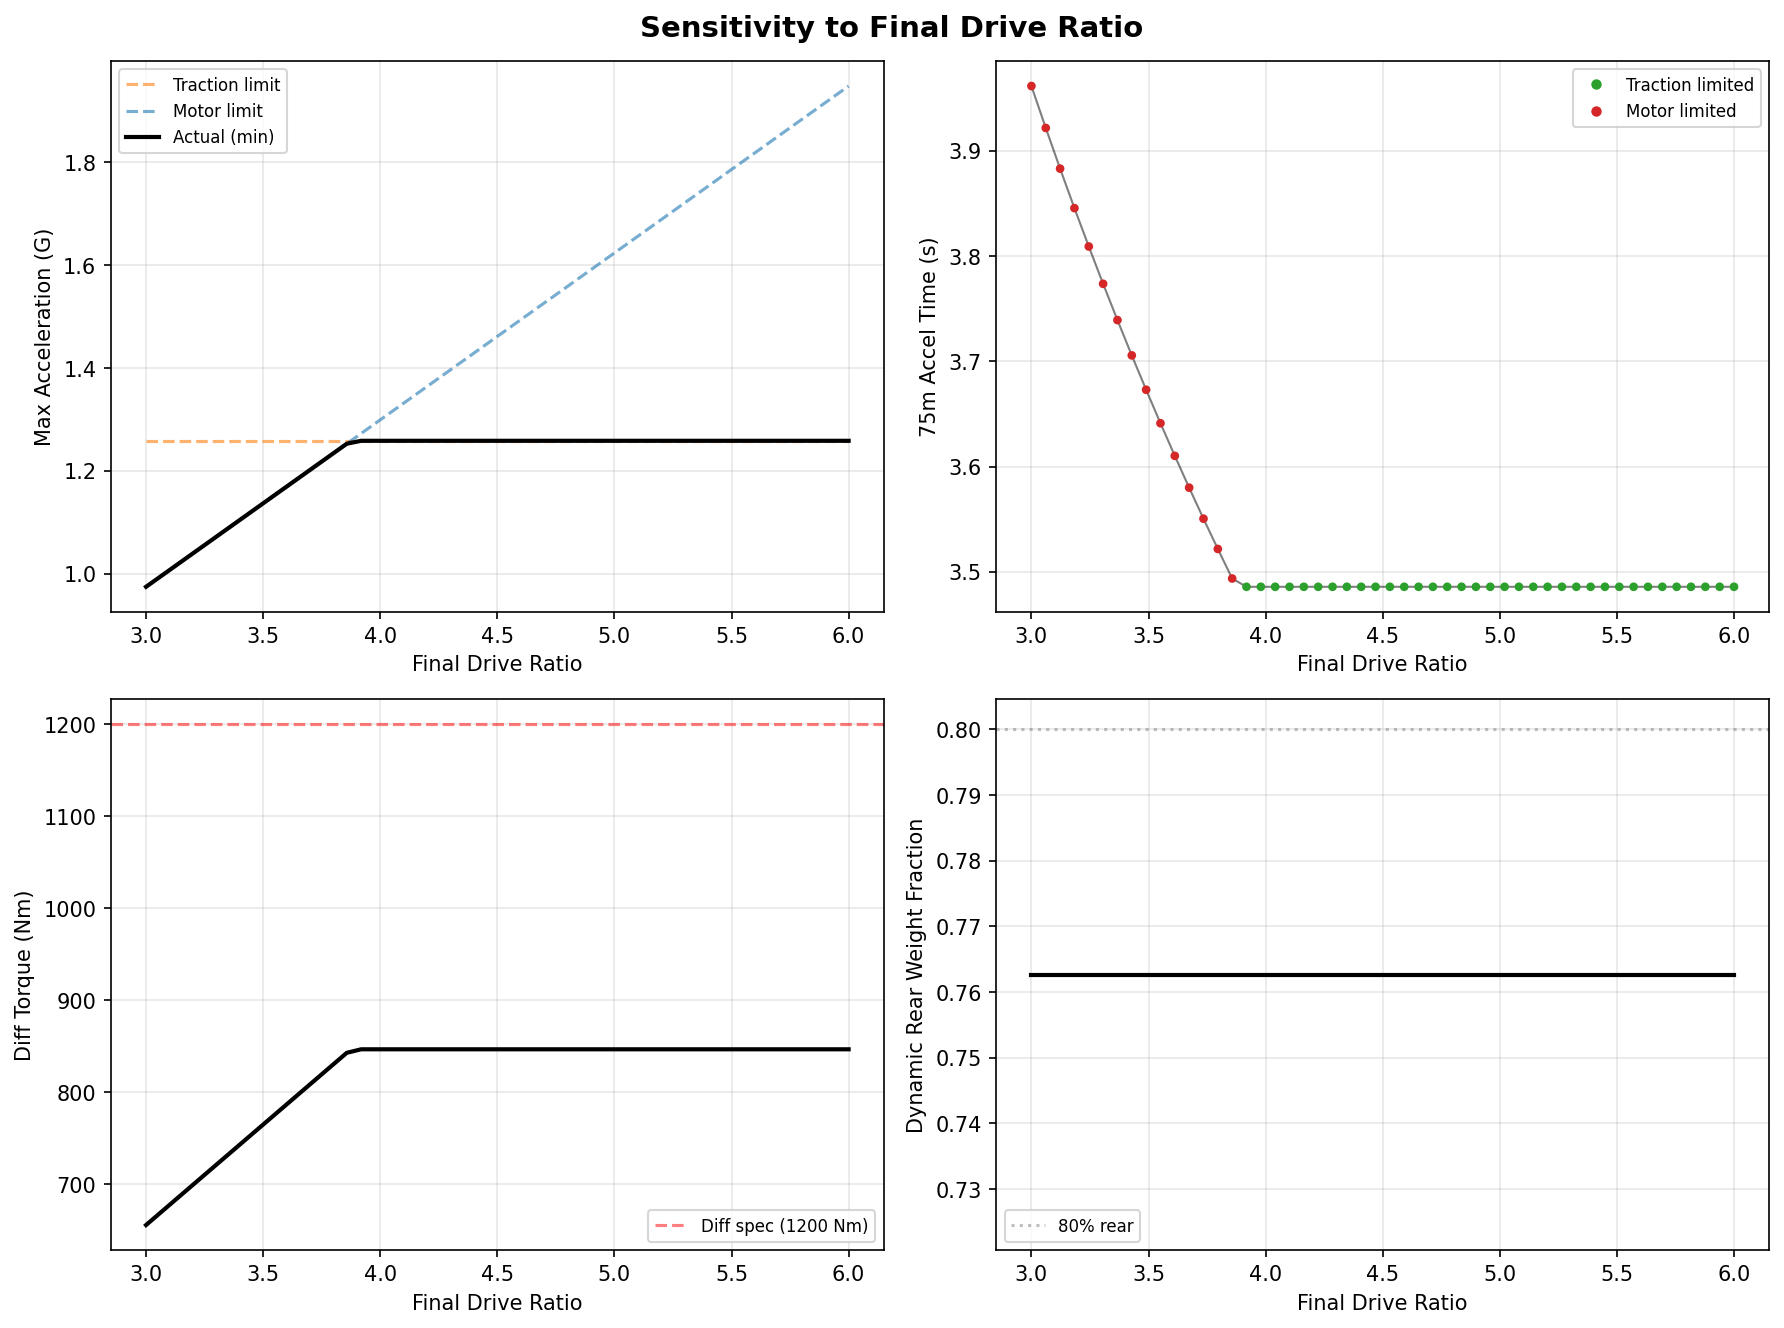
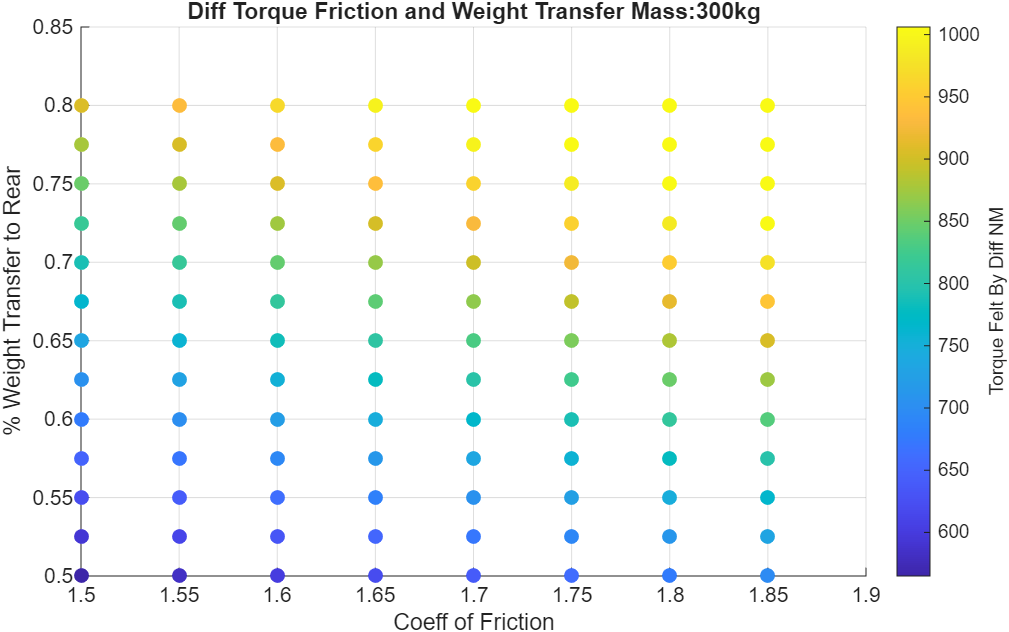
I built a traction model that accounted for:
- vehicle mass
- rear weight fraction
- dynamic weight transfer under acceleration
- tire friction coefficient
- the coupled relationship between acceleration and rear normal force
That let me estimate the maximum usable torque at the differential, not just the motor's theoretical output torque.
Key result: worst-case usable diff torque was about 1000 Nm, set by traction. The differential spec was about 1200 Nm, so the real limit was the tire, not the drivetrain.
This mattered because it answered the drivetrain objection directly. The concern was that choosing a higher ratio would break the diff. The model showed that once the tire saturates, torque is capped by traction anyway.
2. Lap-time and points sweeps
The next question was whether a lower ratio, with more top speed, might still score better overall.
To test that, I ran parametric sweeps across gear ratio and looked at the resulting performance in:
- acceleration
- autocross
- endurance
- total competition points
I used two versions of the sweep:
- 45 kW / 112 Nm as a conservative scenario
- 73.7 kW / 180 Nm as a more realistic scenario
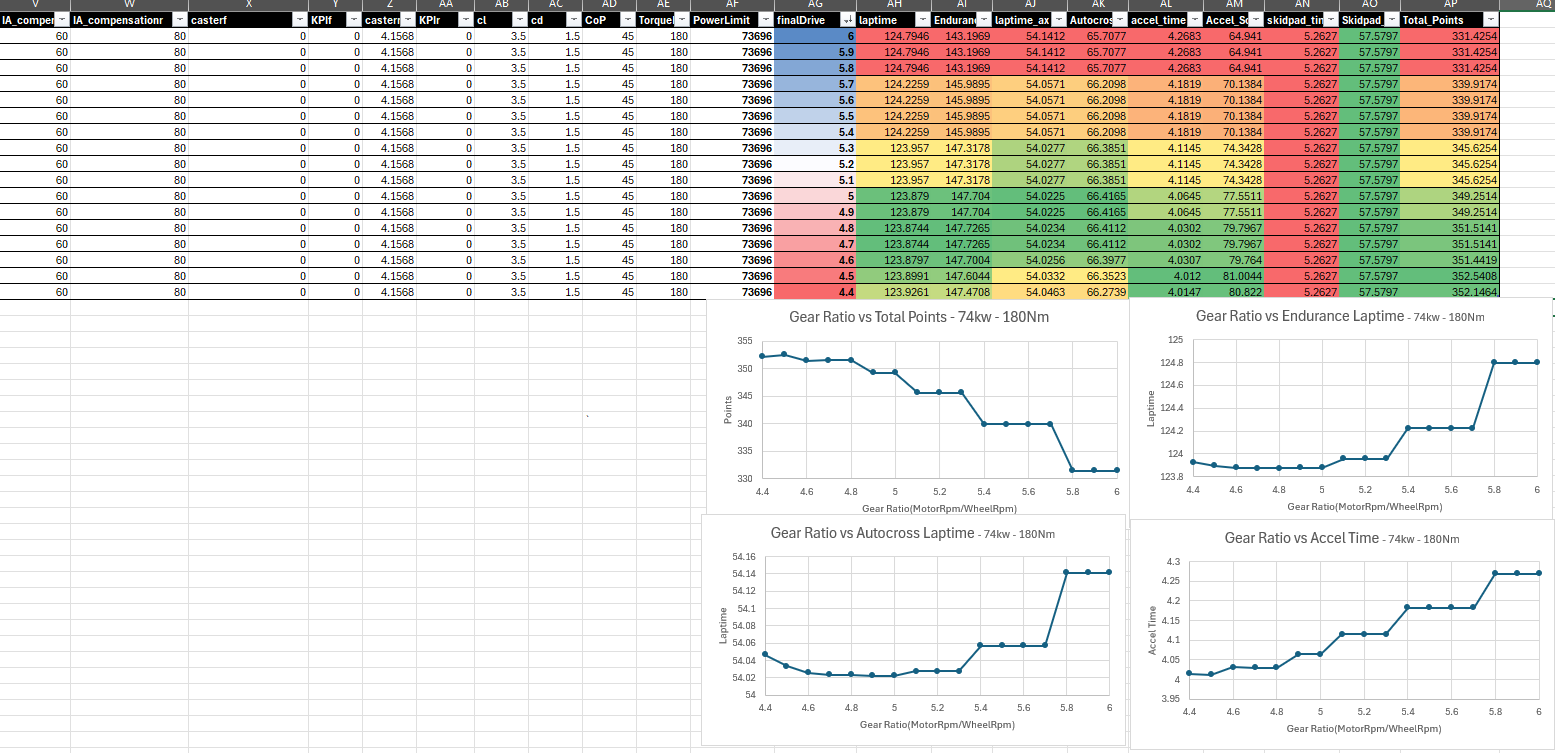
The key pattern was not subtle.
Below the useful ratio band, the car loses a large number of points because acceleration degrades quickly. Above that band, the performance curve flattens, and extra top speed contributes very little.
The risk was asymmetric:
- choosing too low a ratio cost meaningful points
- choosing somewhat higher cost very little until efficiency started to fall off
In the conservative scenario, the penalty for favoring top speed over acceleration was on the order of ~50 competition points. That made the original team intuition much easier to challenge.
3. Motor efficiency mapping
One of the strongest objections to a higher ratio was motor efficiency. The argument was that a lower ratio would keep the motor in a better operating condition and reduce losses.
I mapped the operating points against motor efficiency across the ratio range.
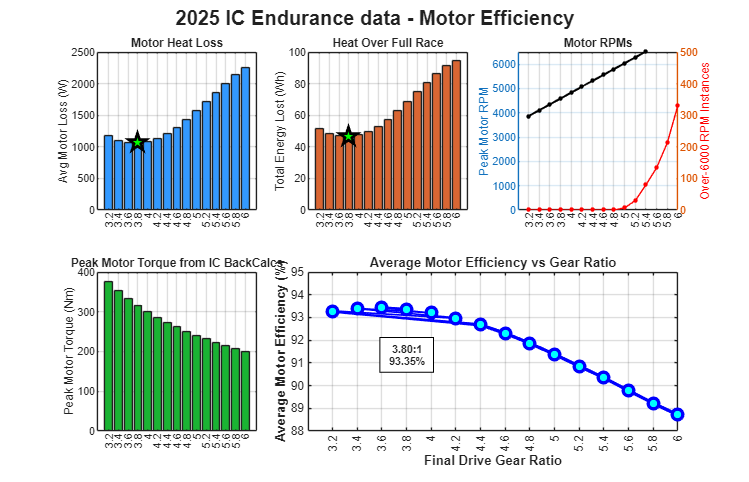
The result was important: efficiency stayed effectively flat over the useful decision band, roughly 3.2 to 4.2, and only started to noticeably degrade above about 4.4.
That meant the efficiency argument against a traction-driven ratio was not valid inside the actual candidate range.
This was one of the clearest examples of replacing a vague subsystem preference with a quantified answer.
The decision window
The useful region ended up being relatively narrow and easy to explain.
- Below ~4.0: the car becomes motor-limited and gives away acceleration
- Around 4.0 to 4.4: traction-limited, strong points outcome, still inside the efficiency plateau
- Above ~4.4: efficiency begins to drop without enough competition upside to justify it
That led to a recommendation centered around ~4.2.
It was not “the one mathematically magical number.” It was the strongest point inside the band where the major objectives were all satisfied at once.
Candidate framing
| Ratio | Interpretation | Verdict |
|---|---|---|
| ~4.2 | Traction-limited and still on the efficiency plateau | Selected |
| ~3.4 | Better top speed, but risks giving away acceleration | Backup only |
| ~5.5 | Extra torque margin, but efficiency loss with little points gain | Rejected |
Turning the analysis into hardware
The value of the work was not just the plots. It changed the design conversation.
This analysis helped shift the team from “which ratio feels right?” to “which ratio wins points without violating real constraints?”
It changed the discussion in three places:
1. Powertrain discussion
The default intuition had been to bias toward top speed. The lap-time and scoring sweeps showed that acceleration mattered far more and that top-speed gains were worth very little in the events we actually cared about.
2. Drivetrain review
There was concern that a more aggressive ratio would overload the differential. The traction model showed that the diff was traction-bounded, not arbitrarily ratio-bounded, which reduced the perceived risk.
3. Efficiency argument
There was repeated concern that a higher ratio would hurt motor efficiency. The efficiency map showed that the chosen band sat on a broad efficiency plateau, so there was no meaningful penalty in the actual decision range.
The analysis was then used to support a sprocket change aligned with the traction-limited strategy.
What this project demonstrates
This is one of the better examples in my portfolio because it shows a pattern I care about a lot:
- a team is arguing from intuition
- the real decision variable touches multiple subsystems
- the correct objective is not the obvious one
- a relatively small model-building effort can make the right answer legible
Technically, it demonstrates:
- first-principles reasoning
- coupled tradeoff analysis
- lap-time / scoring sensitivity thinking
- model-building for decision support, not just reporting
- communication across subsystem boundaries
Just as importantly, it shows engineering judgment. The point was not to produce more plots. The point was to identify the governing constraint, build only enough analysis to expose it, and use that evidence to support a real design choice.
Known gaps and honesty notes
This project still has a few gaps that should be acknowledged rather than glossed over:
- exact measured before / after acceleration times have not yet been recovered from logs
- some sweep inputs were noted in the original analysis as not being perfectly final
- the public page should avoid overstating precision where the qualitative conclusion is stronger than the exact numeric result
That said, the core decision logic is strong. Multiple independent analyses pointed to the same conclusion, and the outcome was robust to uncertainty in the exact parameters.