FSAE Battery Pack Cooling Experimentation
This work was conducted for the University of Victoria Formula SAE team's electric vehicle battery pack (2026 season).
Motivation
Over the course of endurance (22km, ~25 minutes) our battery pack has to maintain temperatures under 60°C (FSAE rules for maximum cell temperature). My cell and race profile modeling tools showed either cooling or power limiting must be done to keep our pack within temperatures.
Action
I decided physical testing would be faster than CFD. The result of this experiment was creating a correlation between fan power and the heat transfer coefficient (cooling ability).
Result
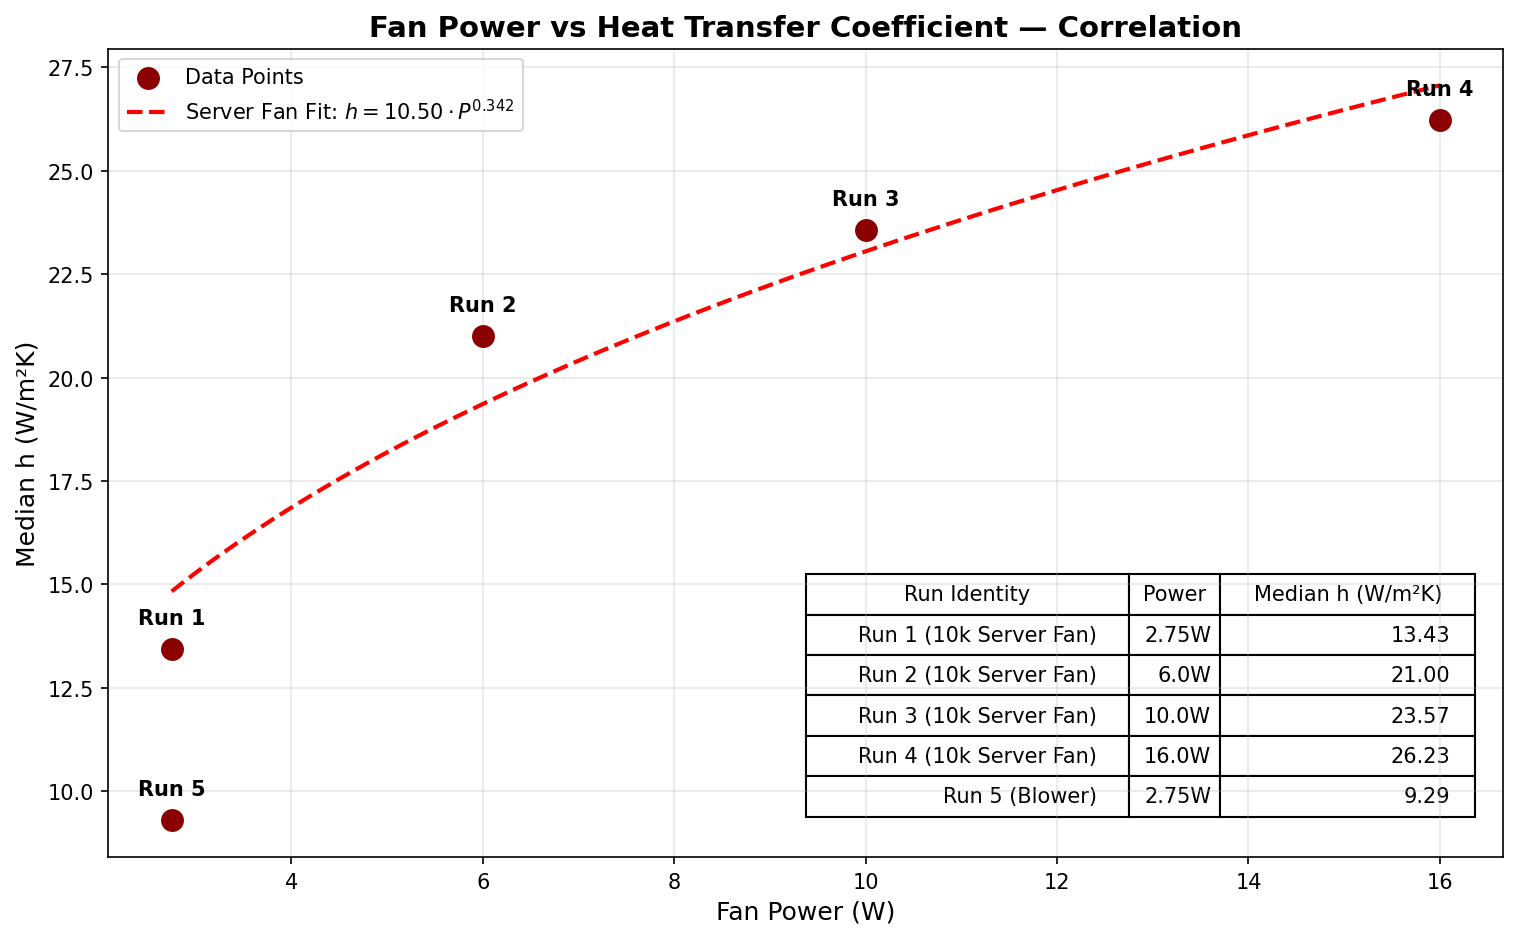
Fan power vs heat transfer coefficient — the key deliverable from physical testing
The correlation h = 9.97 × P^0.462 allows us to predict cooling performance at any fan power setting. At 10W fan power, we achieve h ≈ 24 W/m²K. However, the h-coefficient alone doesn't tell the whole story. As air flows past each row of cells, it absorbs heat and warms up, reducing cooling effectiveness for downstream rows. Our analysis accounts for this cumulative air heating effect to determine realistic "max safe ambient" temperatures, giving us high confidence that our cooling system can maintain cell temperatures below 60°C even in unusually hot conditions.
Why Physical Testing?
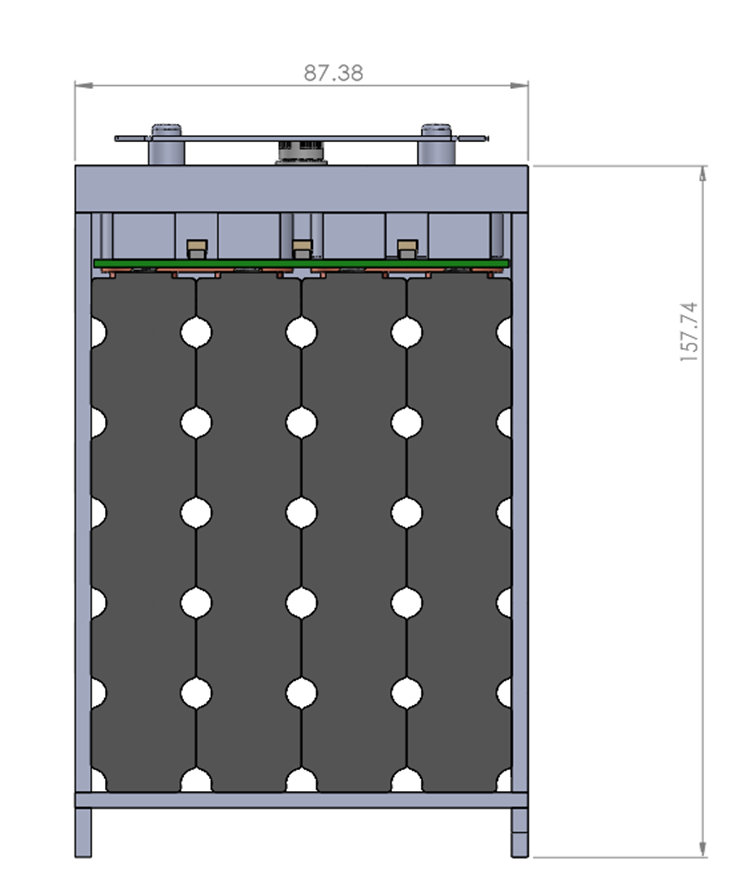
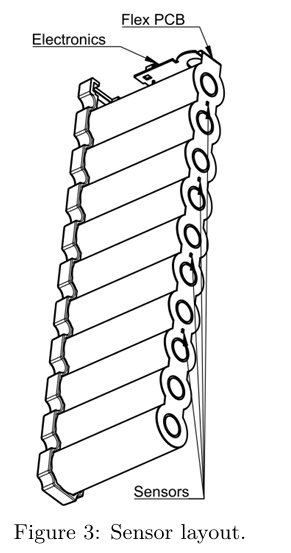
Front view of our module design (23 Enepaq bricks in a module)
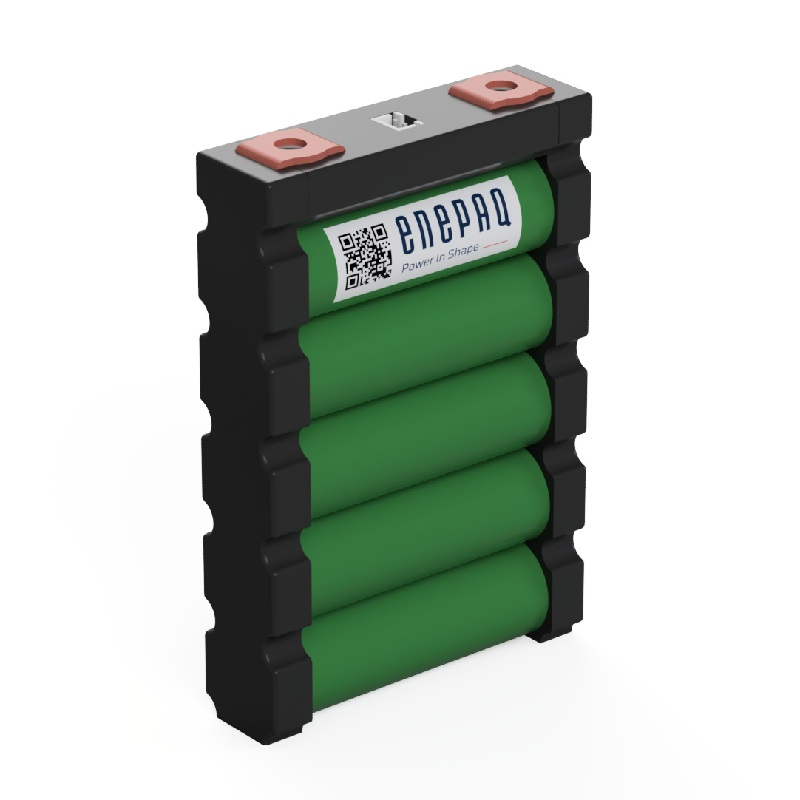
Single Enepaq brick structure
The irregular geometry of Enepaq modules makes analytical heat transfer calculations (from array cooling textbook examples) unreliable. Physical testing was the fastest path to valid results.
Contents
Jump to expandable sections:
- CFD Attempts & Discord Advice — in CFD vs Experimentation
- MATLAB Files & Learning Process — in Heat Transfer First Principles
- Design Gallery — Mock Brick Photos & CAD — in Designing
- Test Setup Details — in Testing
Diving Deeper
Understanding
The fundamental energy balance for cell cooling:
For cooldown, Q_gen = 0 and convection is the main heat path:
Which gives us Newton's law of cooling with thermal mass:
CFD vs Experimentation
This project originally started because I set out to create realistic cooling estimates for our battery. I had a brief stint of trying to set up thermal CFD but quickly realized that I was neither confident in heat transfer fundamentals (started this in 2024), nor understood CFD solvers. I ended up asking the FSAE discord and Ethan Perrin (Tesla Battery Engineer, personal communication) pointed me toward IRL physical testing being much more likely to give valid results much faster.
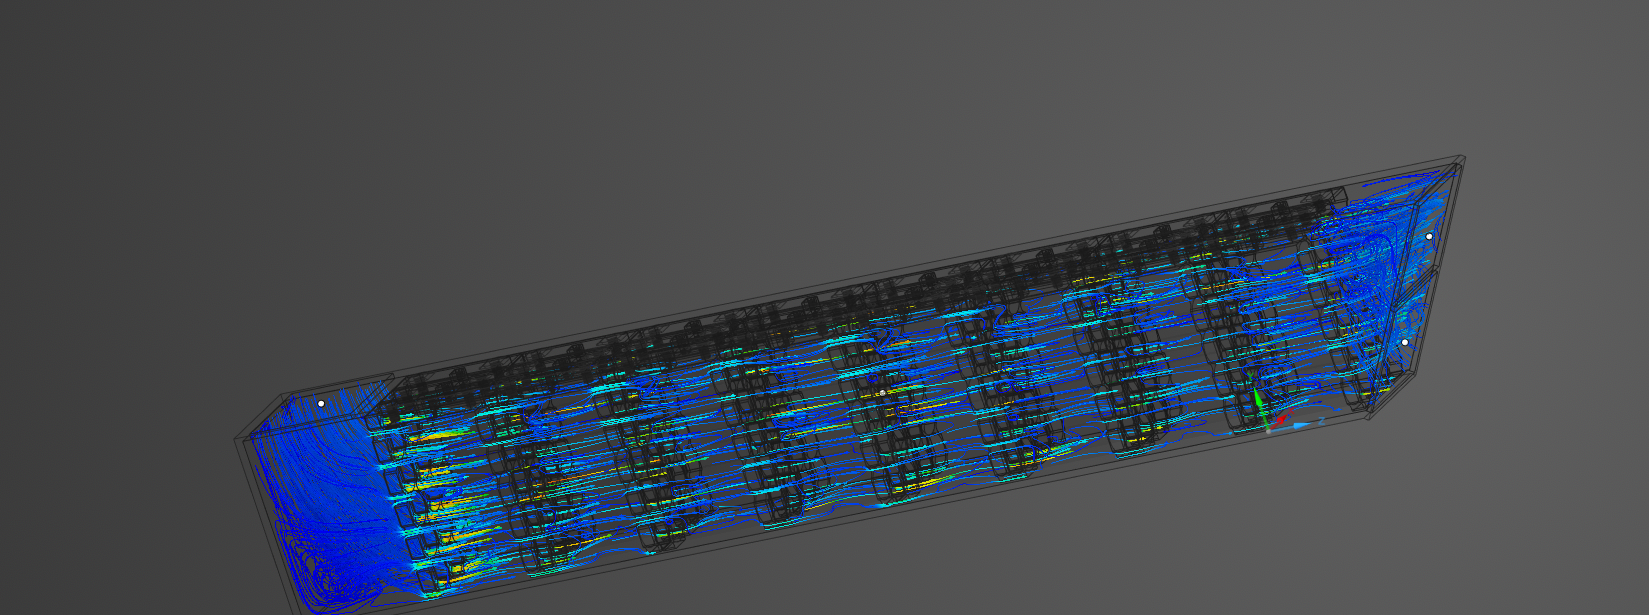
Very nice colors, oooh ahhhh.
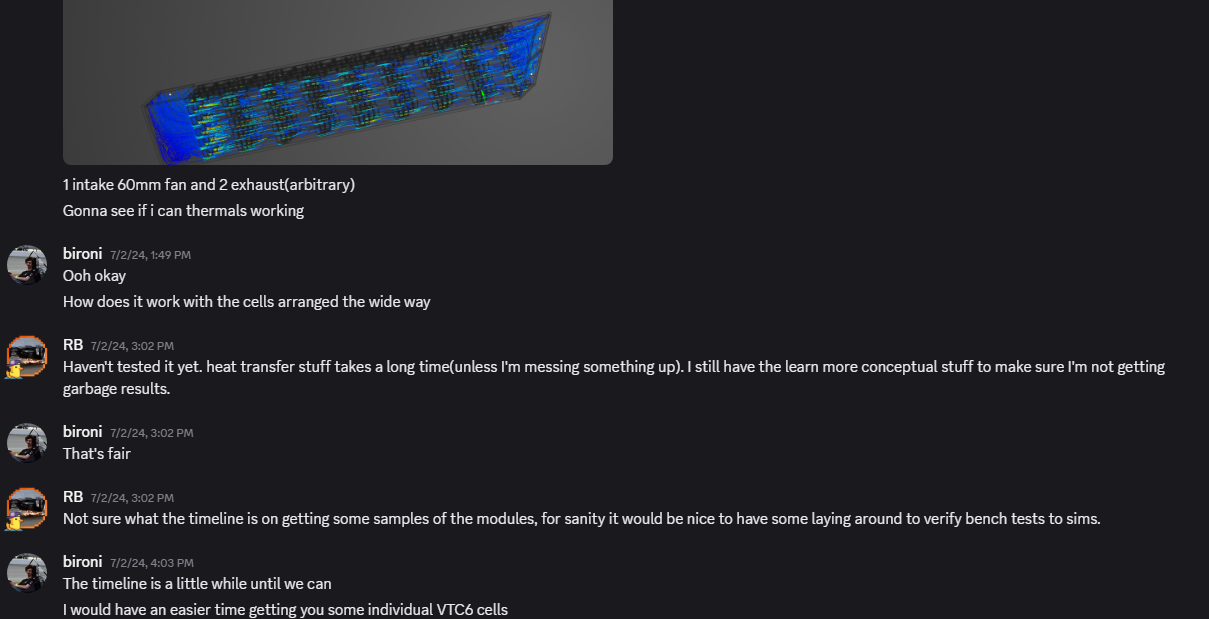
I very much wanted to try out testing on the real thing
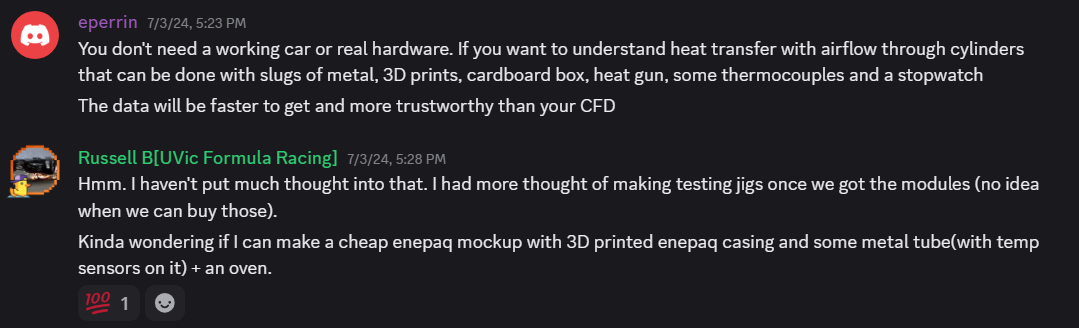
Getting some advice from the FSAE discord

Put on the path of getting a valid result and not just a result
Early attempts at CFD and the conversation that redirected me toward physical testing.
Heat Transfer First Principles and MATLAB Files
The start of this project was in the semester before I had taken my university's heat transfer course. Before I designed any test setups or plans I worked on a couple thermal models in MATLAB.
Here's some of the files in order of what I remember creating. The PDF previews of the live scripts aren't that good, but it was some form of leaving documentation of my process.
See the full MATLAB learning files: Heat Transfer First Principles
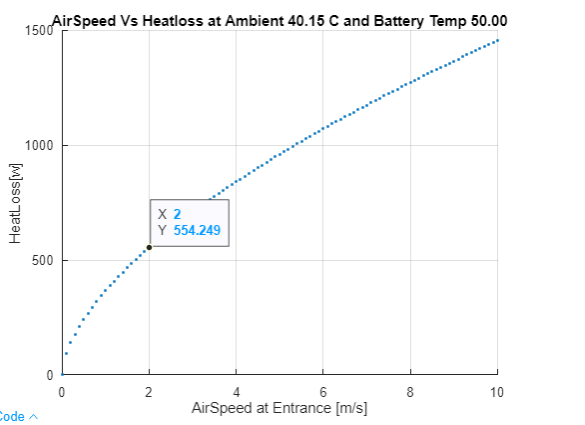
What even is 2m/s?
Early thermal models I built before taking heat transfer — Array cooling, dynamic similarity, Nusselt correlations
Remaining Unknowns
The MATLAB models gave me fundamental understanding, but several parameters remained uncertain. I have ideas to look deeper into these, but more pressing priorities take up my time for the amount of benefit these would give.
- Airflow velocity — fan specs don't translate directly to air speed over cells
- Future: "trash bag" airflow measurement test
- Turbulence effects — how does fan-induced turbulence affect heat transfer?
- Future: push vs pull test, moving Enepaq modules to change how many bricks flow-condition or turbulate the air
- Pressure drop — what's the system impedance across the module?
- Future: Arduino + differential pressure sensors
- Cumulative error — how do uncertainties compound in detailed models?
- Future: Find an elegant/intuitive way to display this
Too many unknowns to trust a model.
Designing
The goal: create a mock Enepaq brick that could be heated and have air blown past it. Success criteria:
- Build quickly
- Approximate thermal characteristics of real batteries
- Test quickly and repeatably
Aluminum turned out to be ideal. It has similar density and heat capacity to lithium-ion cells at room temperature. The problem was I could only source imperial stock in Canada (5/8" vs 18mm cells).
I wrote a dynamic similarity script (see MATLAB dropdown above) to check if imperial stock would skew results. Verdict: close enough for valid data, but 18mm stock would make the mock modules dimensionally identical to real ones. Worth the wait.
The AliExpress Saga
University purchasing delays pushed this project back over a month. I ended up buying the aluminum myself from AliExpress. I designed two mock brick versions:
- 3D printed: Cheap, fast. Mainly for validating system airflow impedance
- Laser cut: Wood + aluminum rods. Enables oven preheating to test progressive air heating
The designs worked surprisingly well. The downside was by the time everything arrived and laser cutting was done, finals season was approaching.
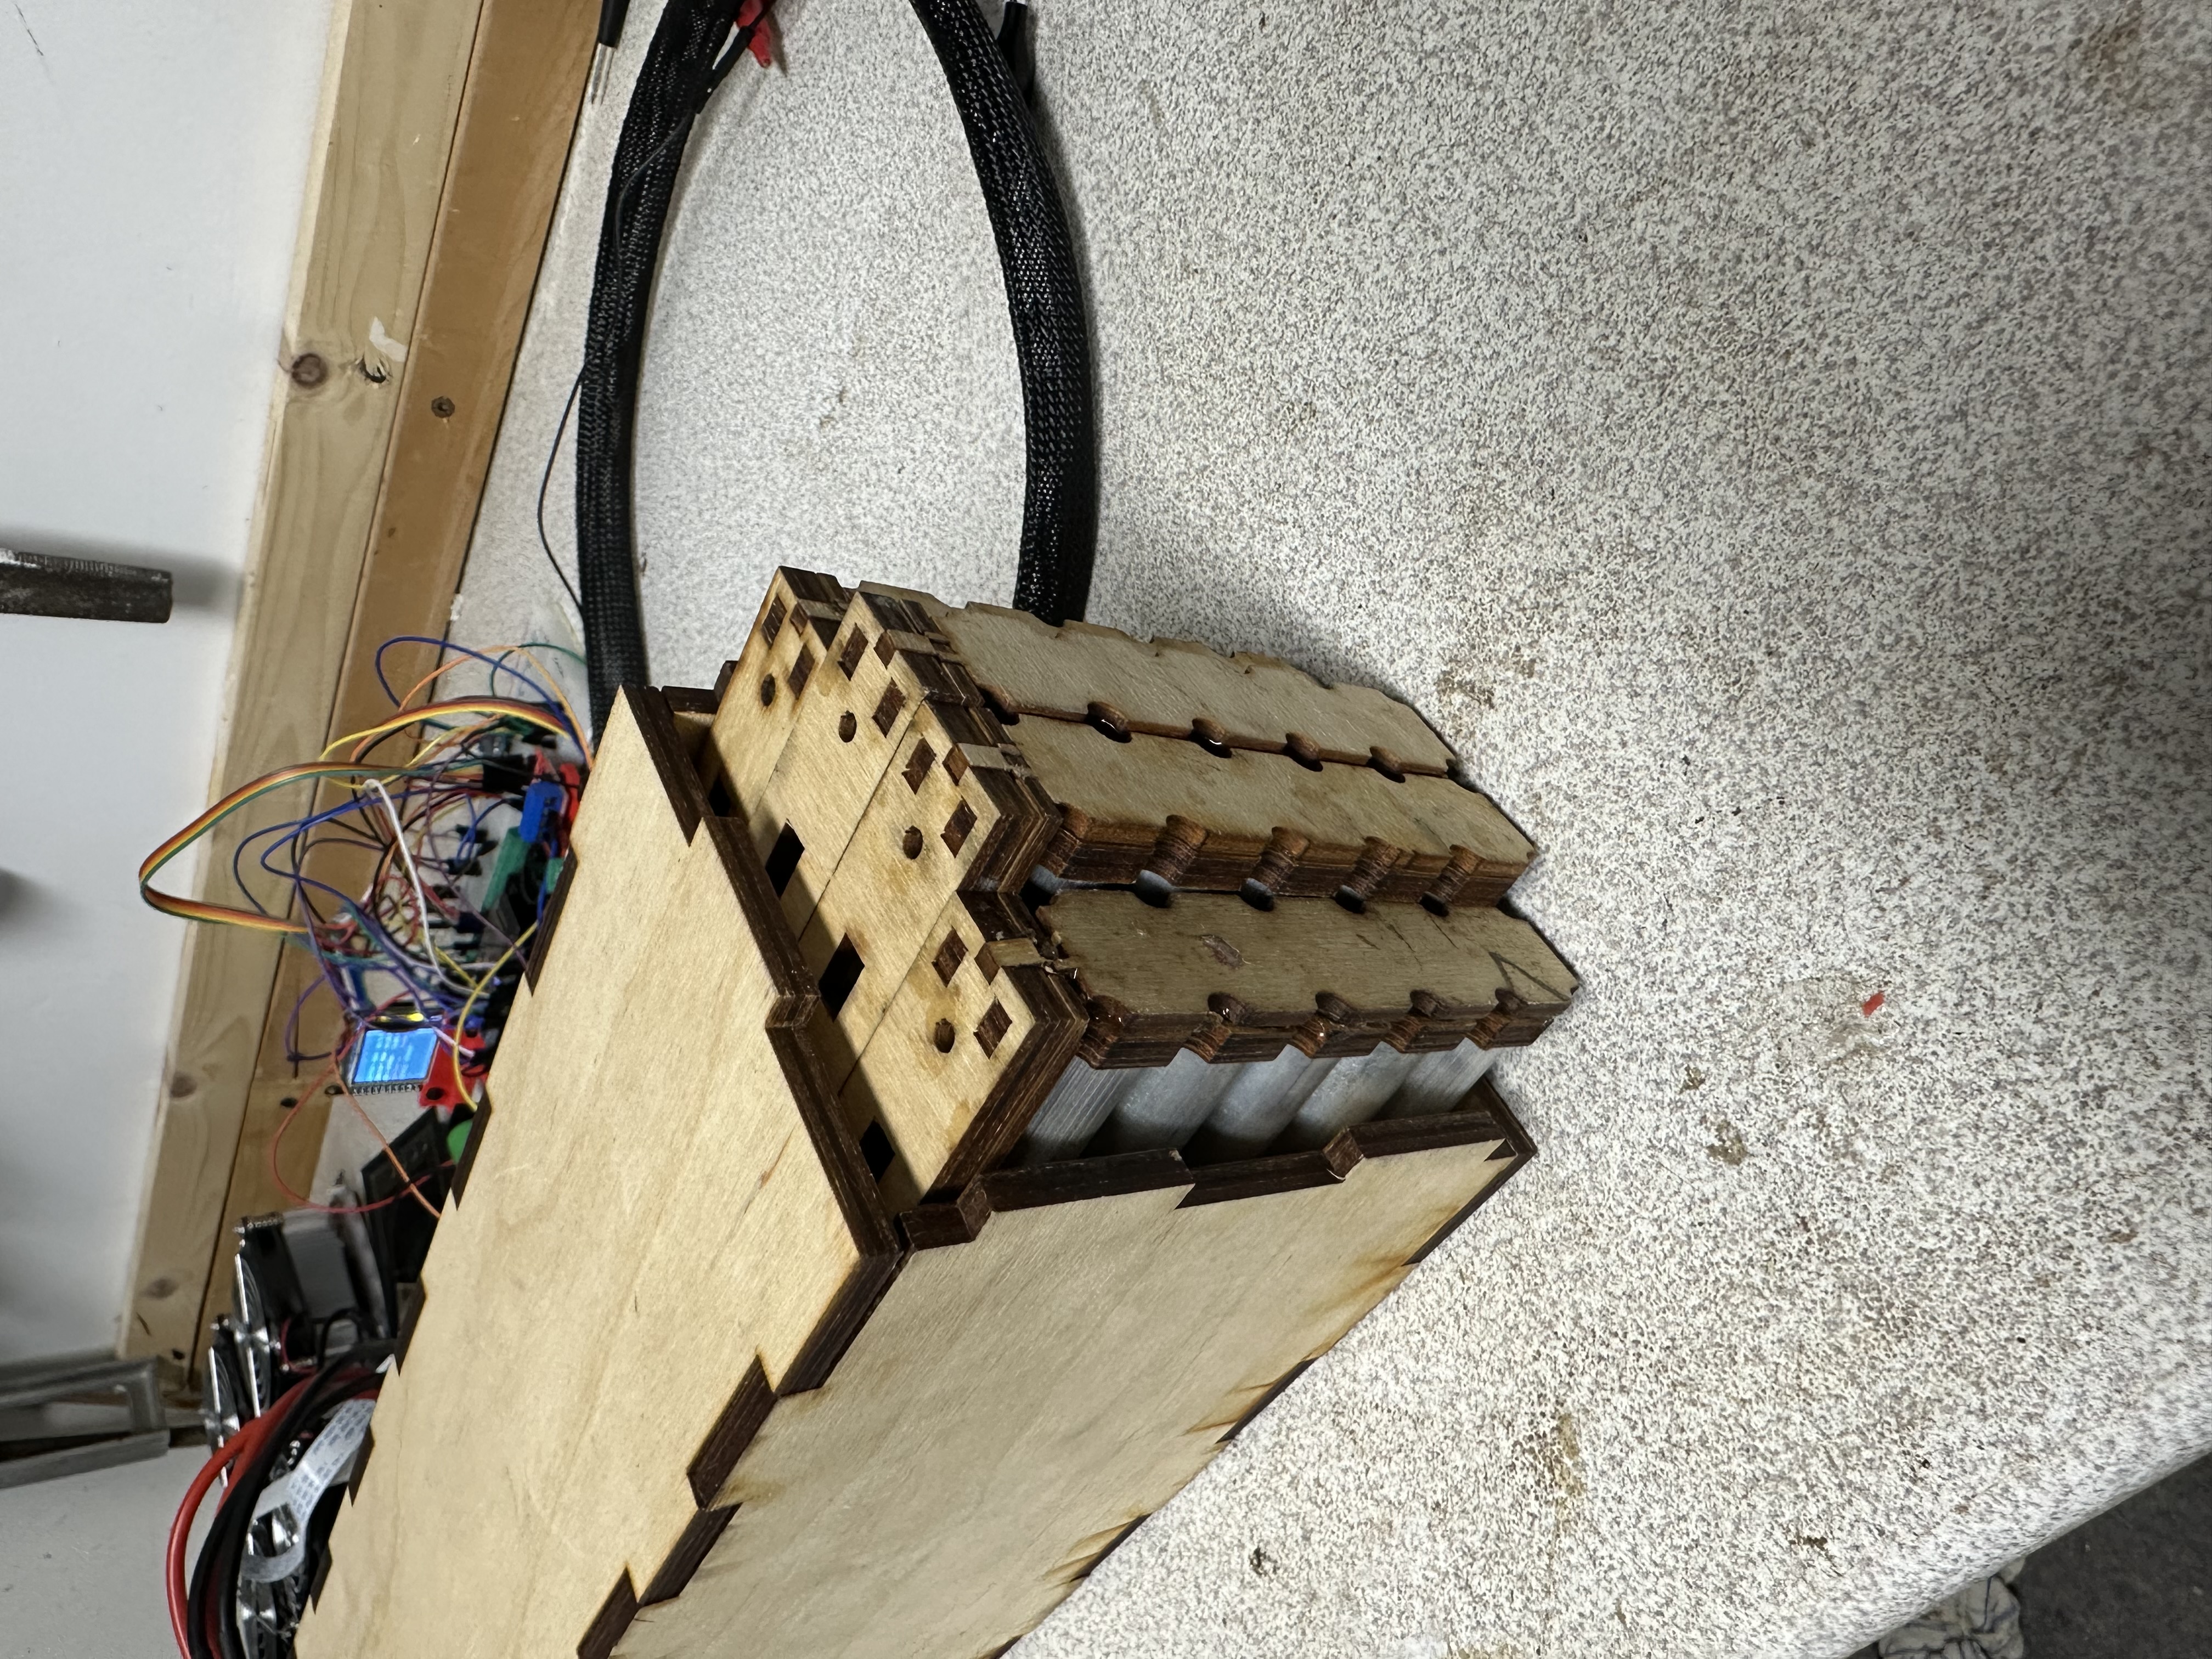
Mock Brick Design
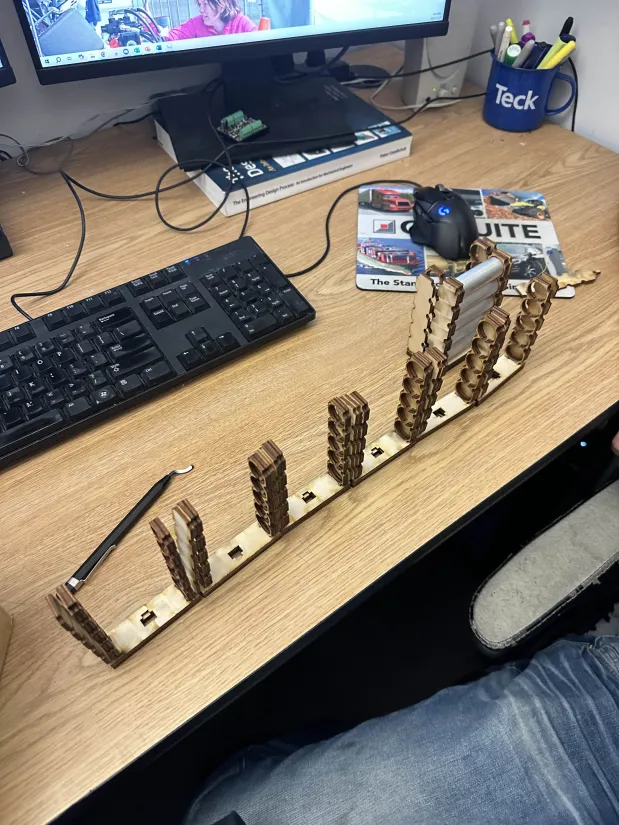
Laser-cut mock Enepaq brick with aluminum rods. Similar thermal mass to real 18650 cells
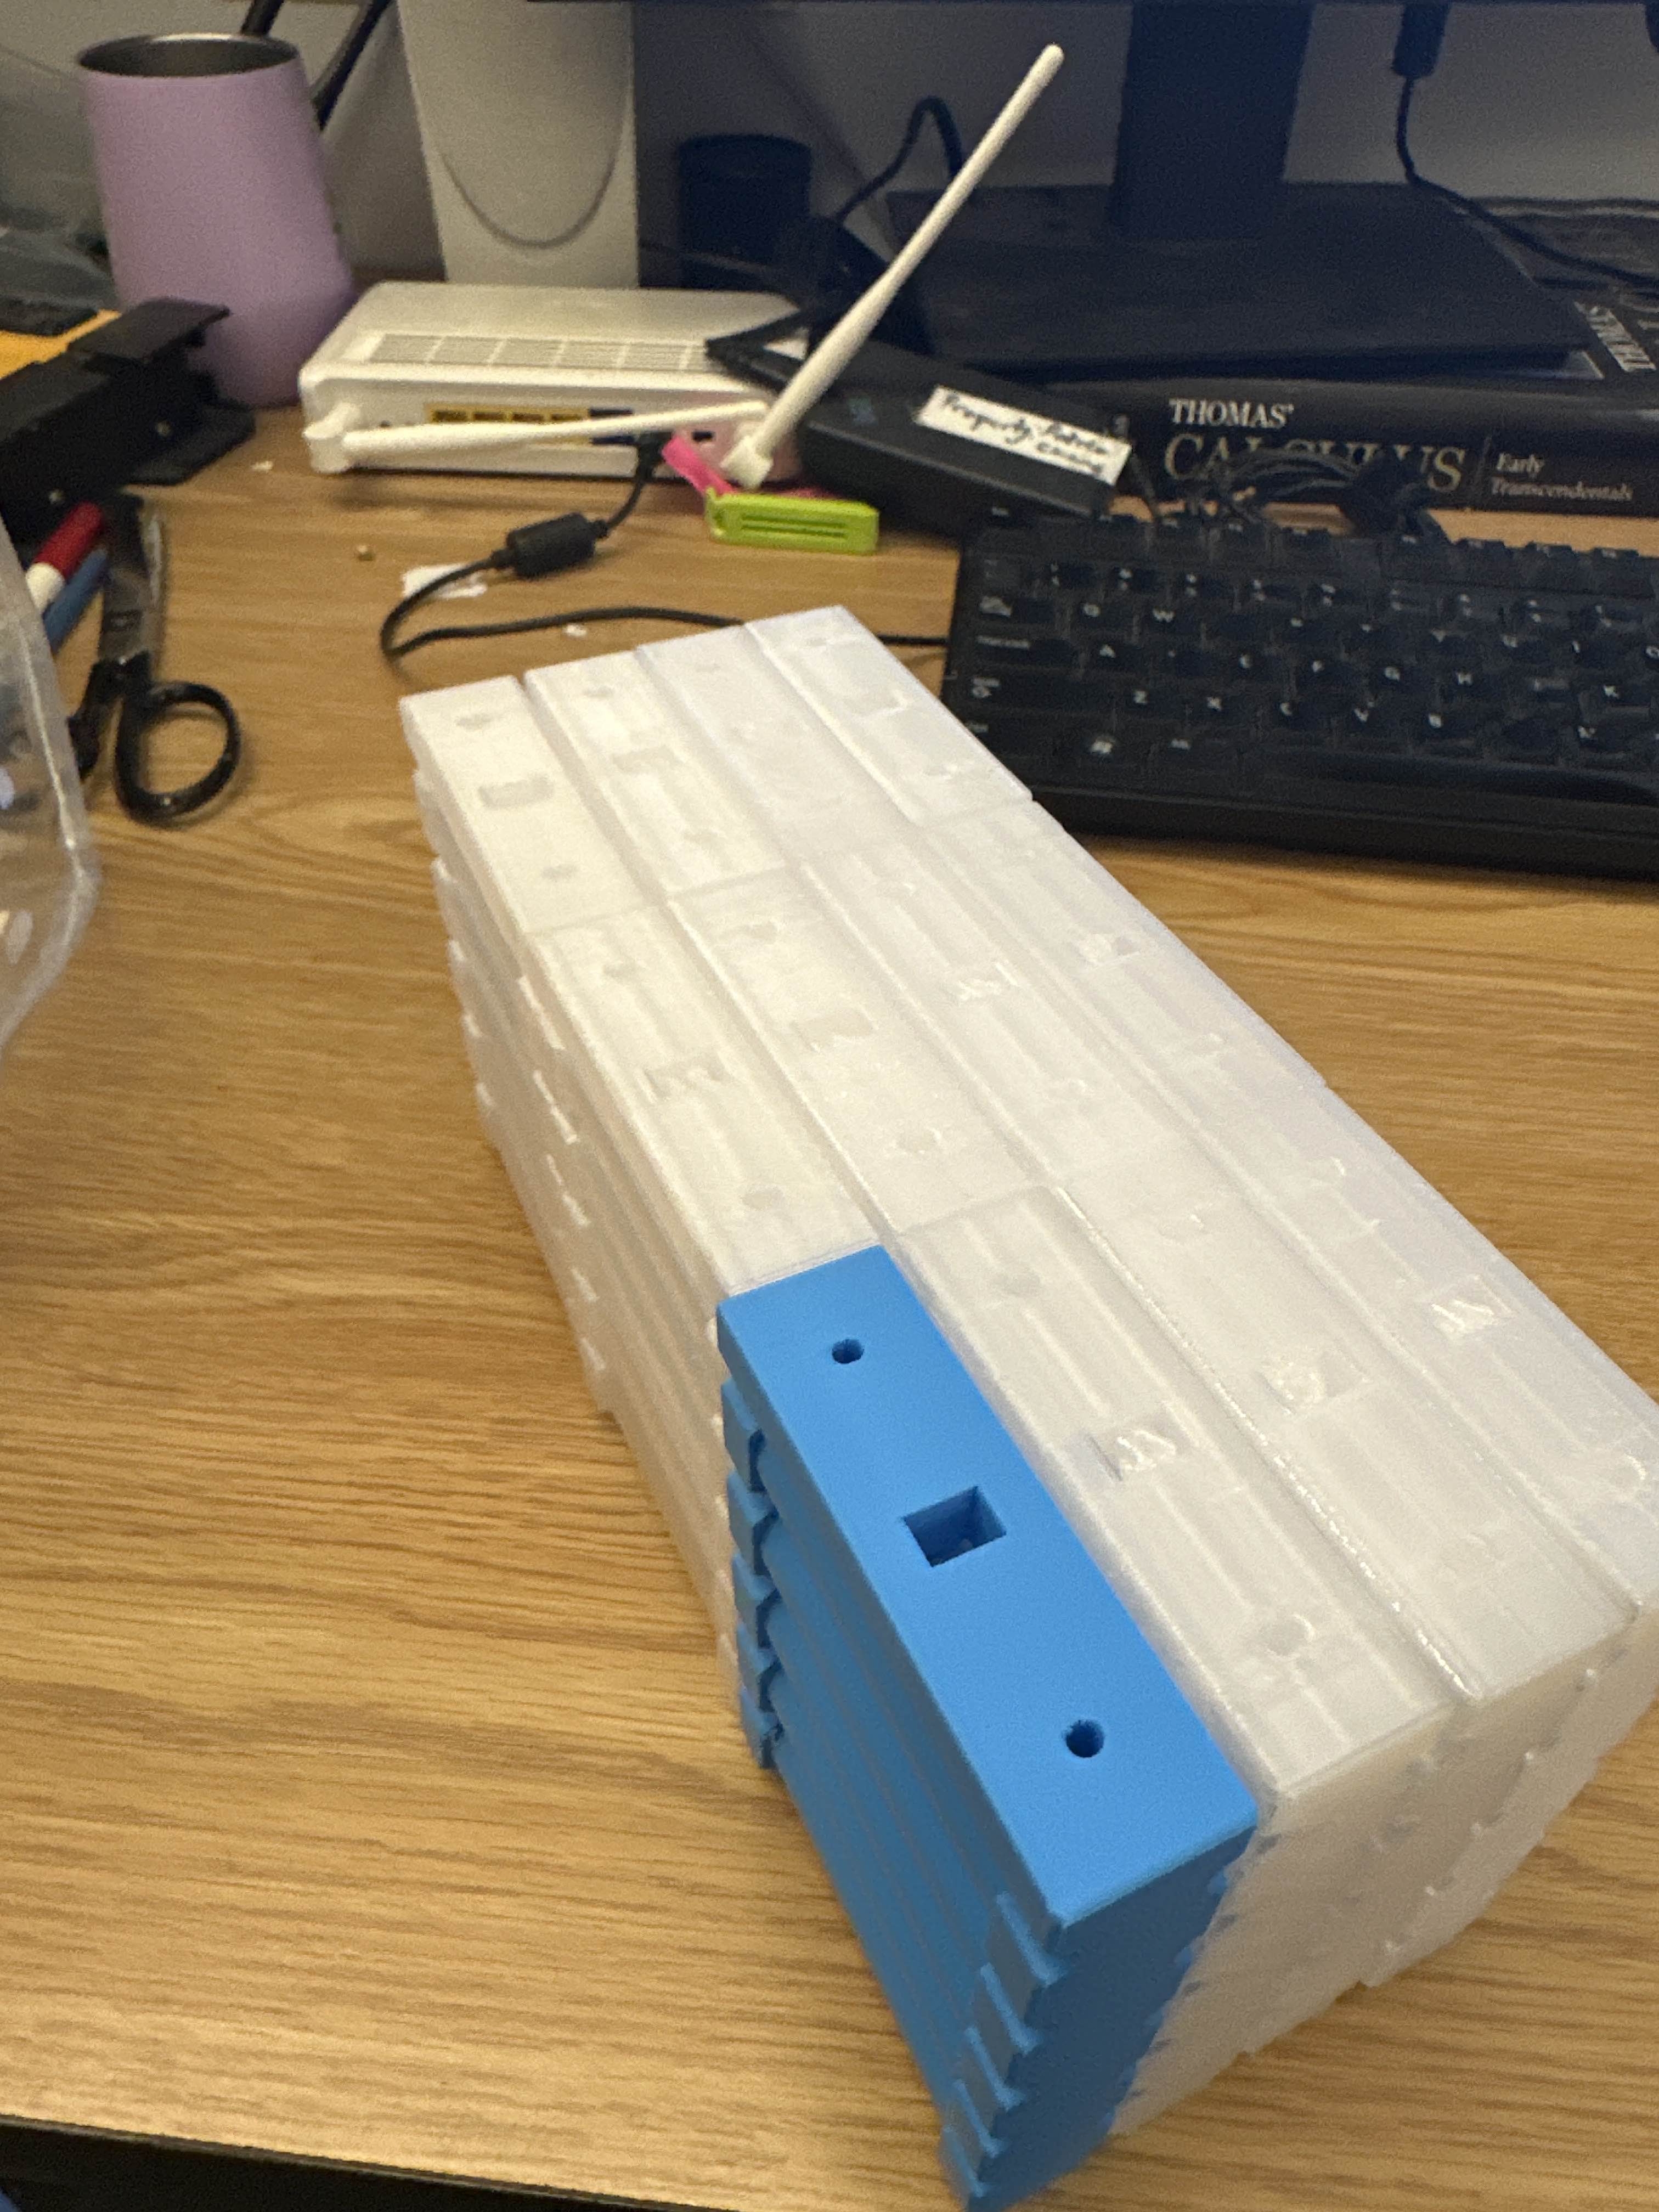
3D printed brick
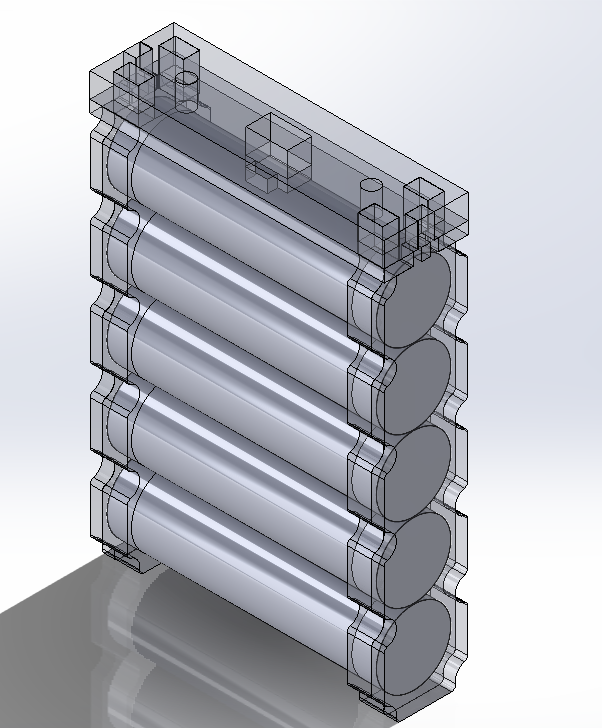
CAD model of laser-cut design
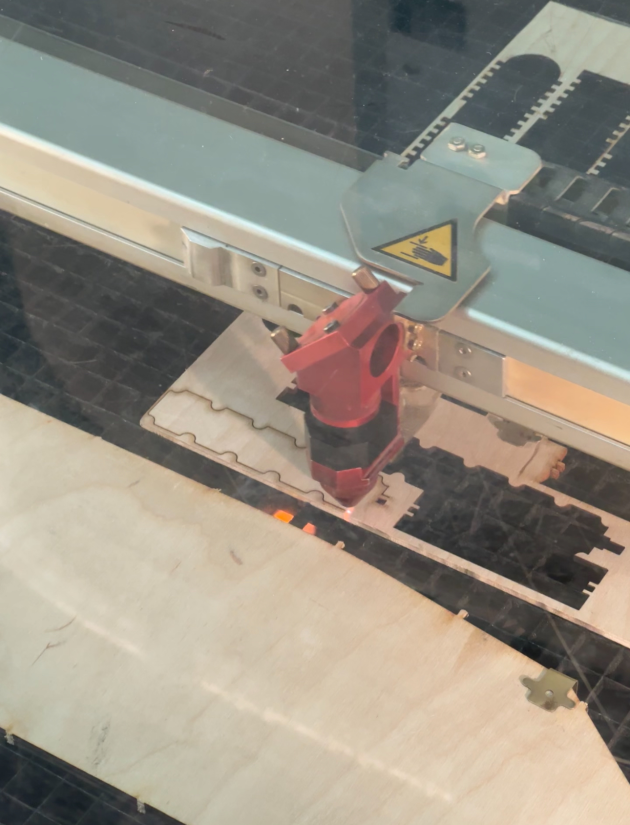
Laser cutting in progress
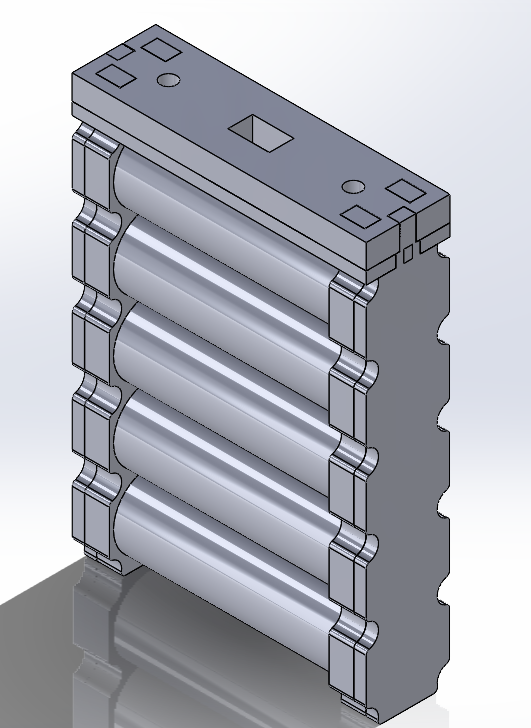
Non-transparent CAD view
3D printed and laser-cut mock Enepaq brick designs
Testing
There were two types of tests:
- Aluminum mock Enepaq brick (heated externally by heat gun)
- Real Enepaq brick (heated by electrical discharge)
Scrappy Test Setup
Temperature measurement used K-type thermocouples with thermal paste, taped to the aluminum surface. Data was logged via a Chinese TC logger to CSV files.
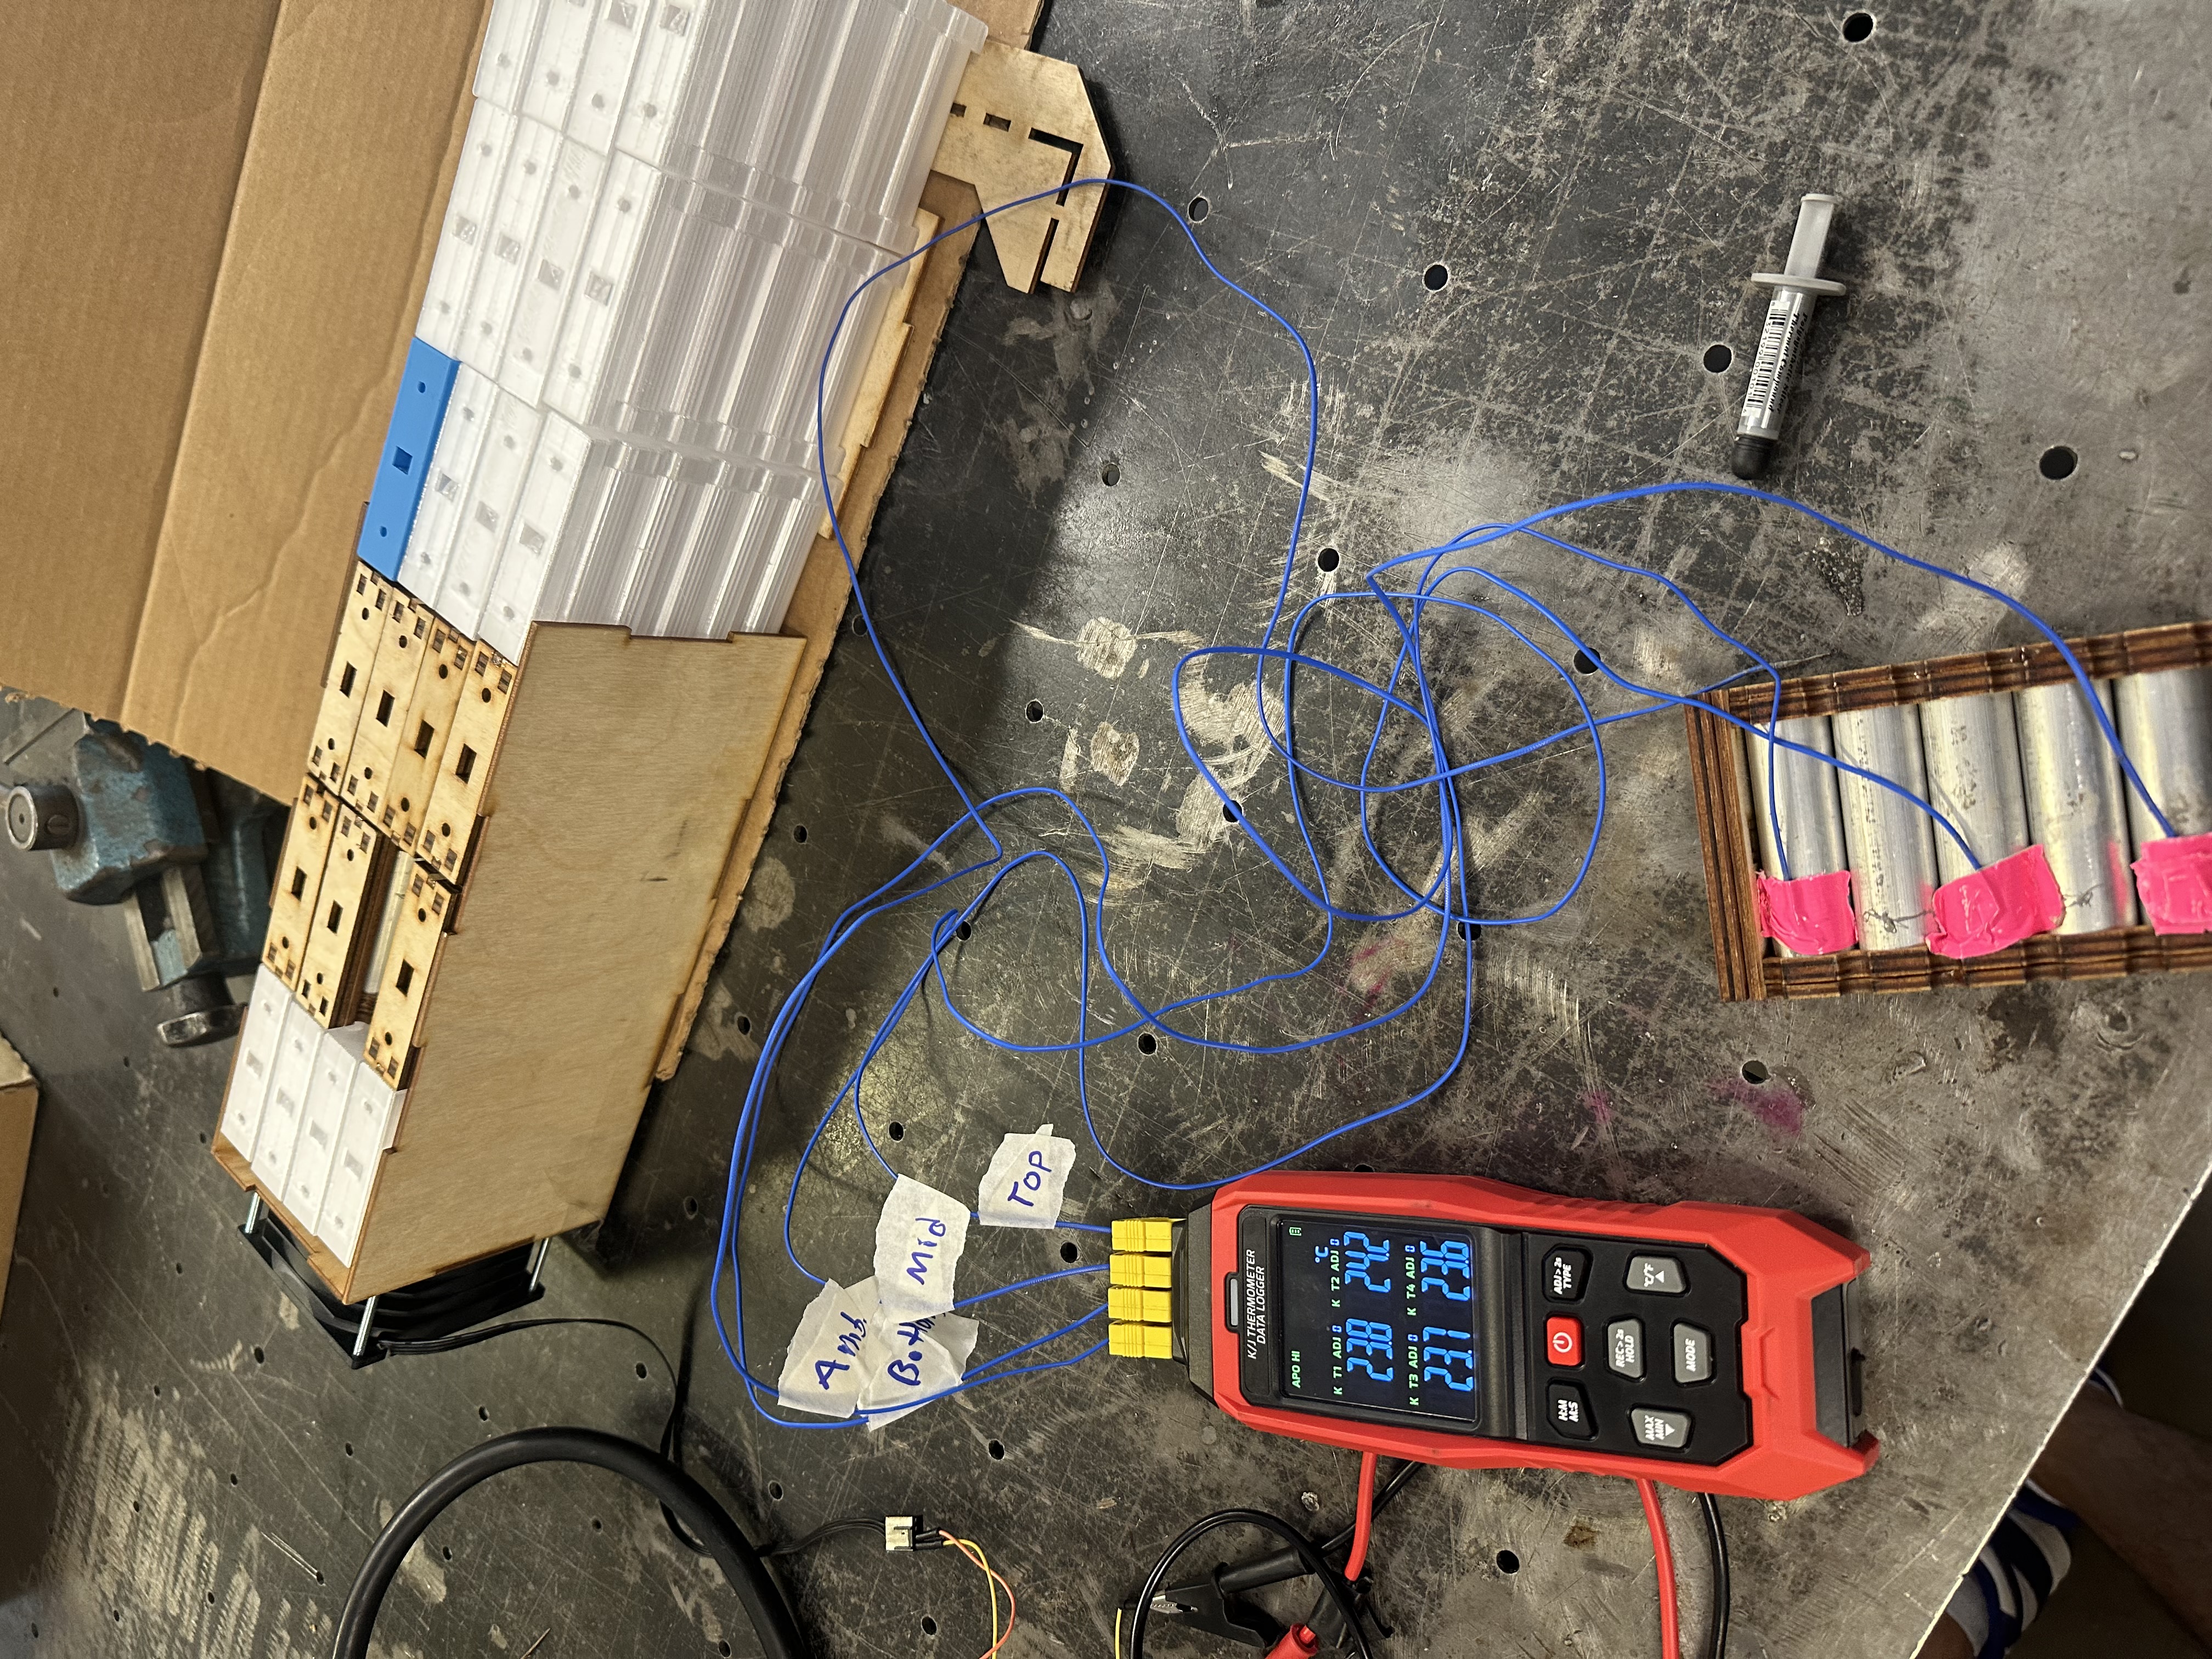
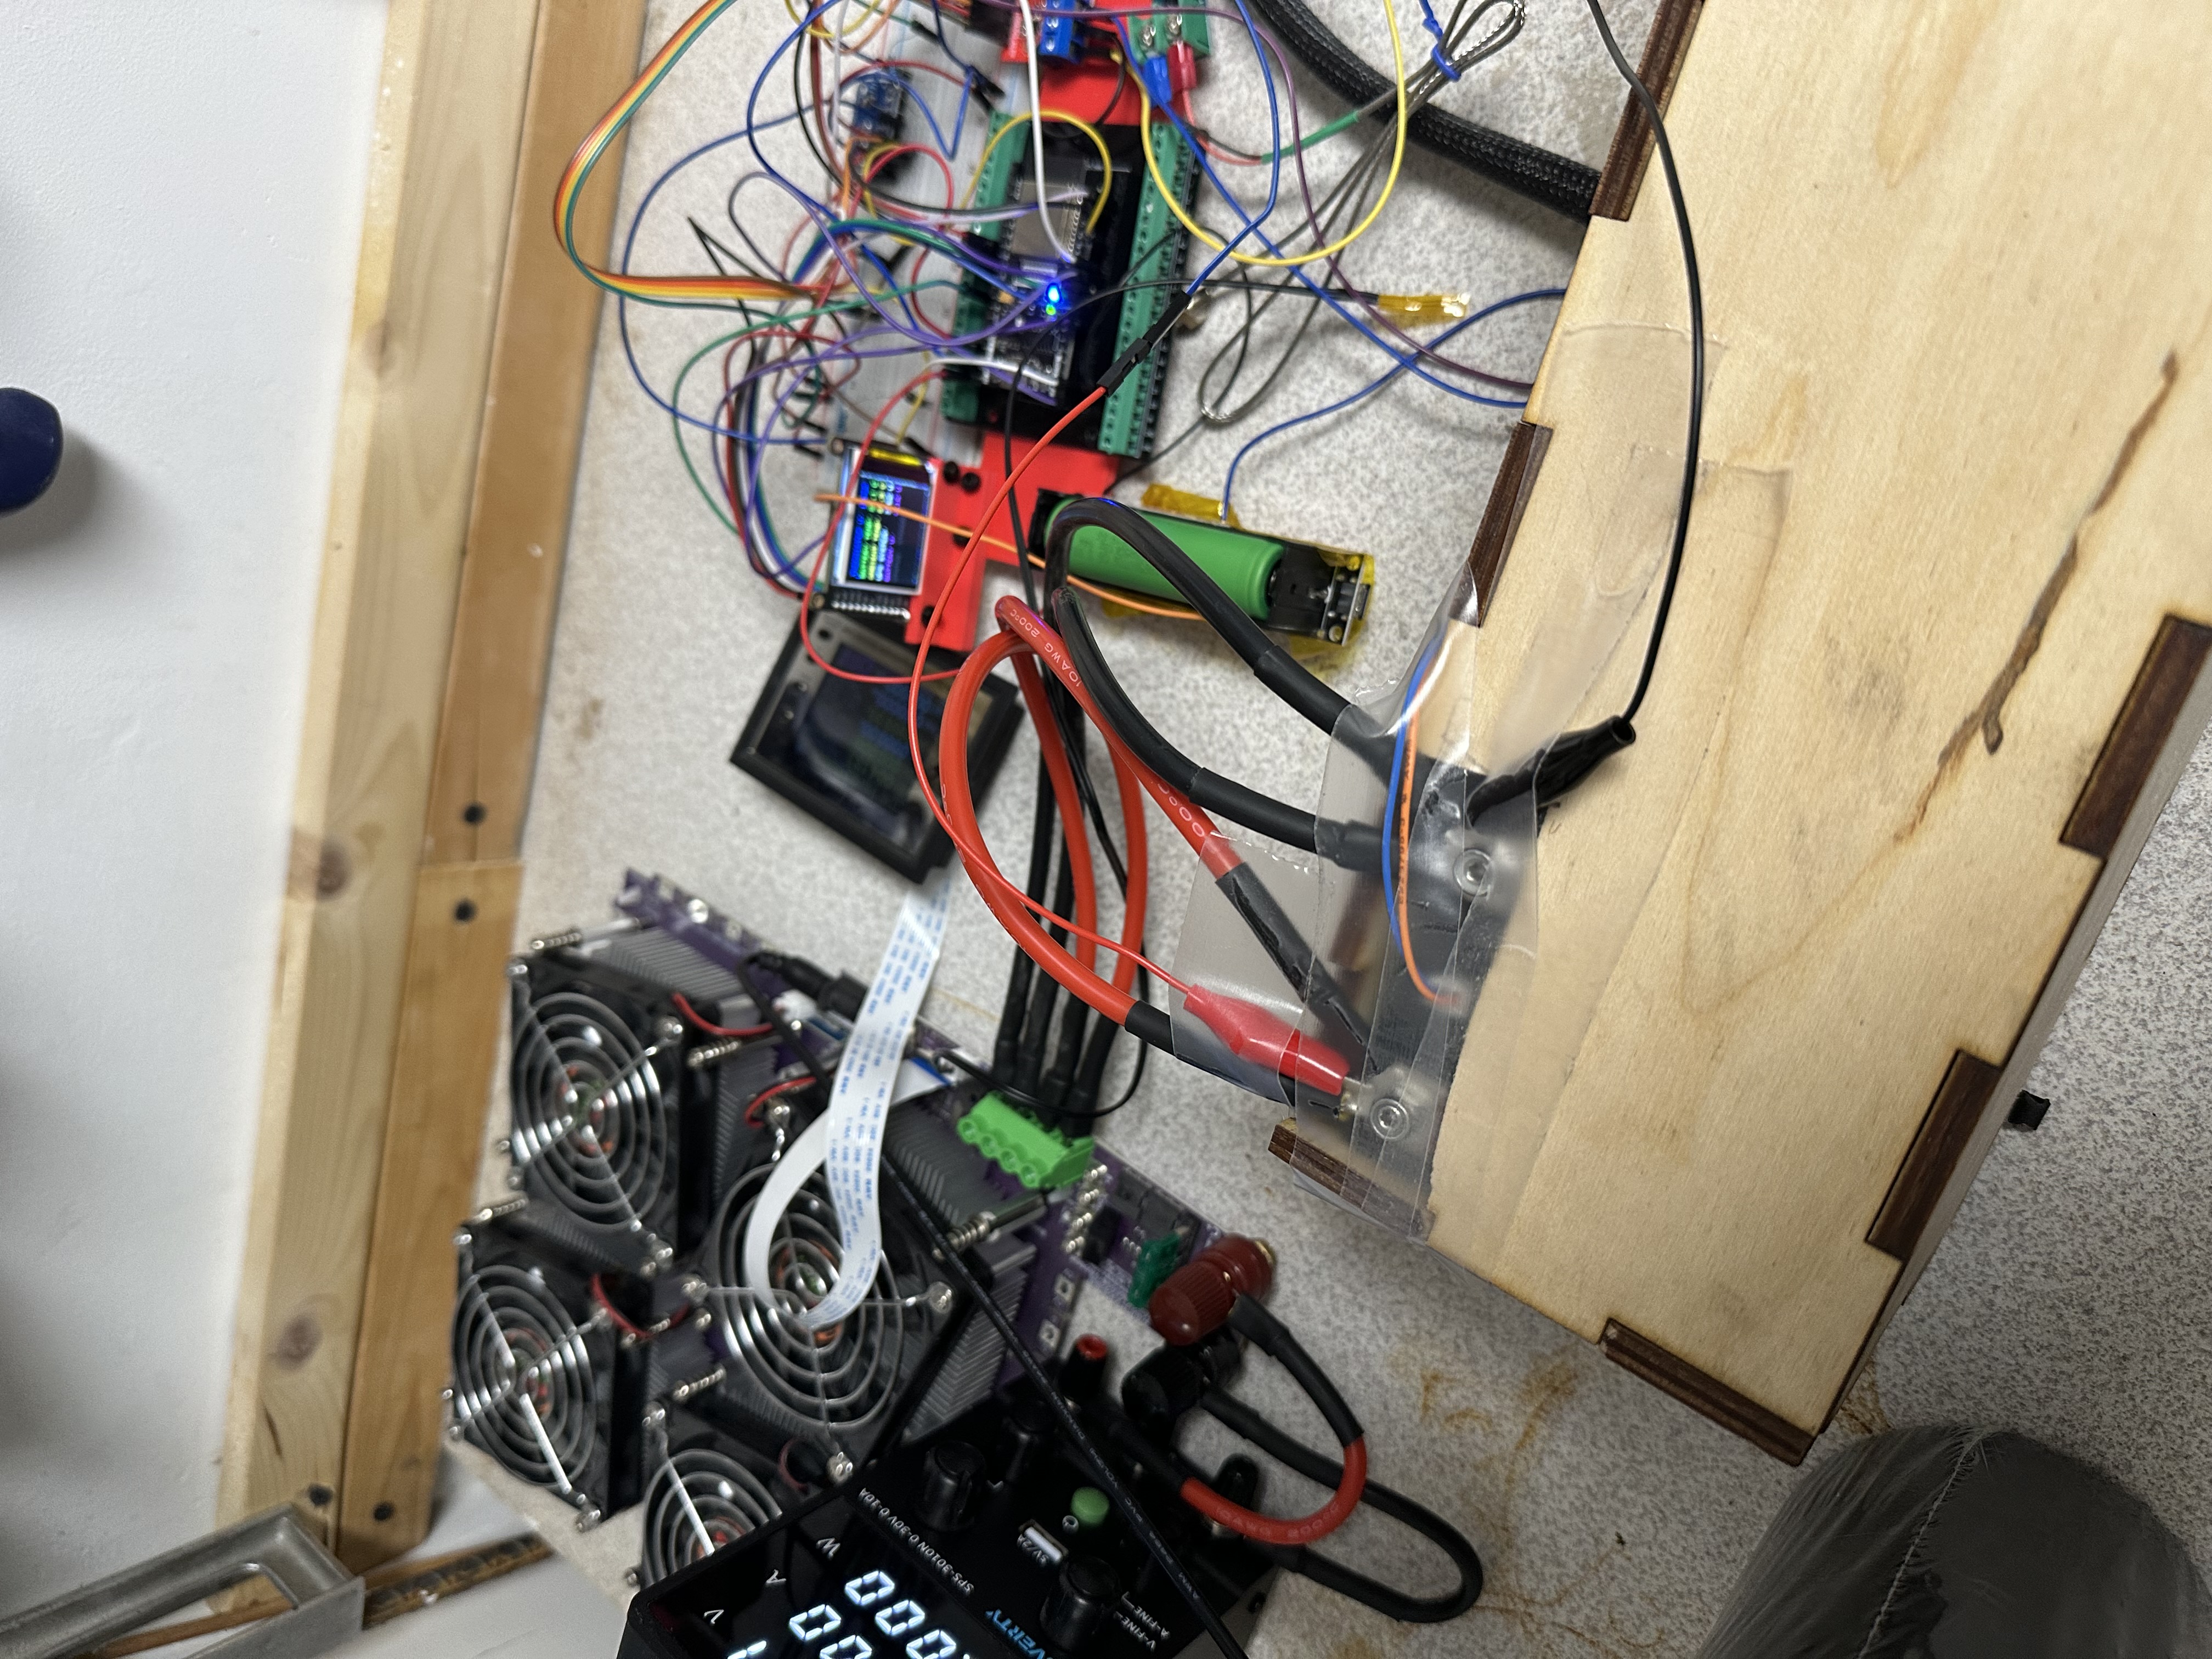
Test setup showing thermocouple placement and airflow configuration, this was the first day everything was printed out and the DAQ was working. This is NOT the setup used, its my best photo that displays everything in one view.
Early testing with aluminum "dummy" bricks — these initial experiments gave us unusually high h-coefficients due to unreliable thermocouple adherence and didn't account for the "hottest cell rule" or progressive air heating across rows
Real Enepaq Brick Testing
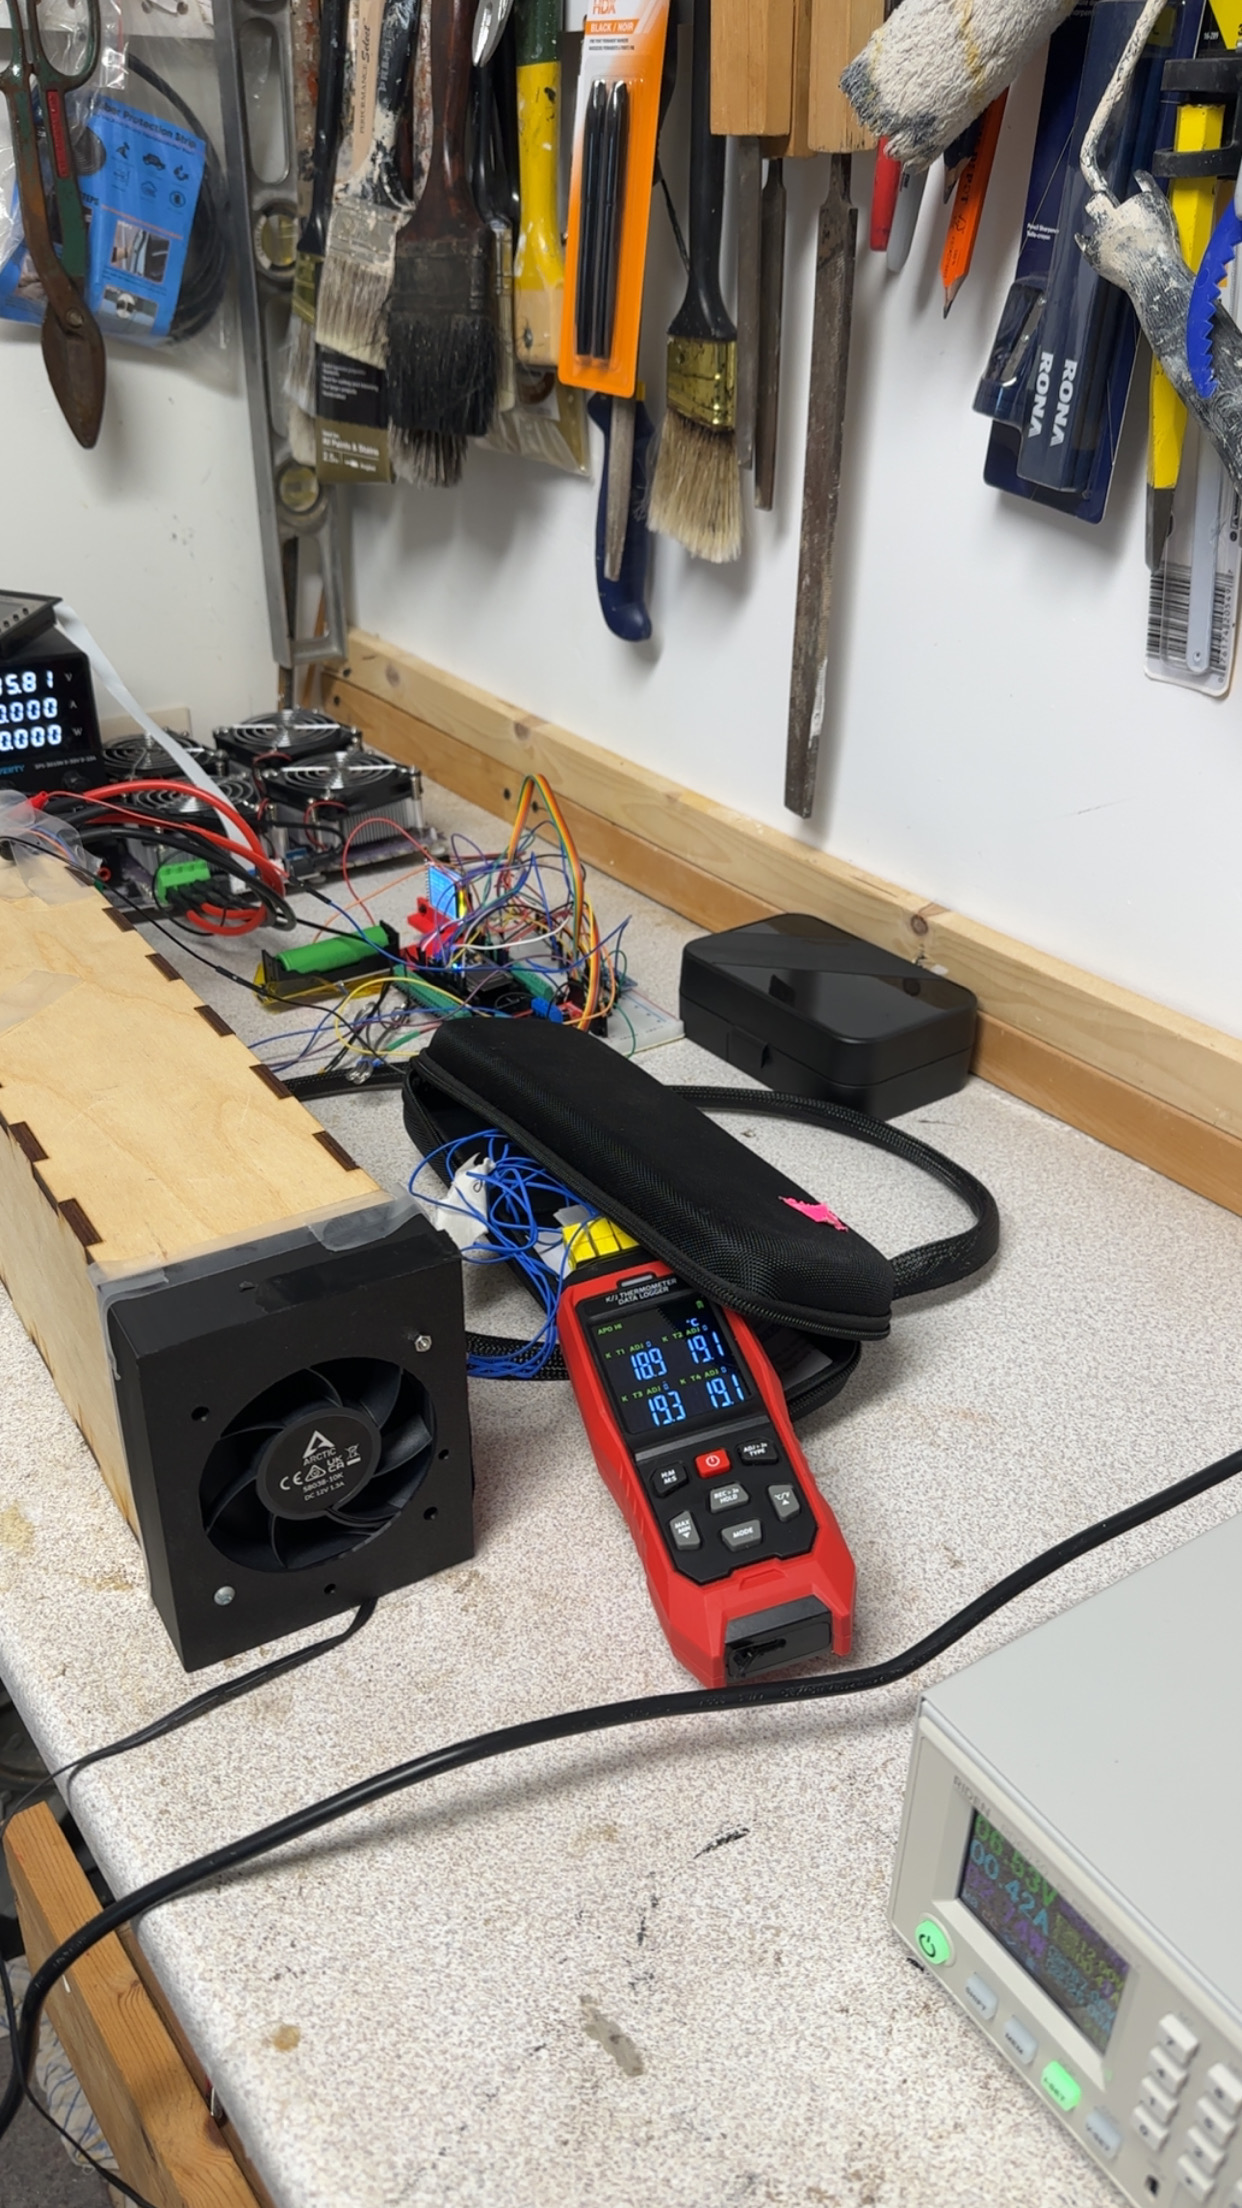
Full test setup overview — Enepaq brick, airflow segment, power supply, and data logging
The Enepaq brick's built-in thermistors provided comparison data for the live cell tests. These internal sensors are shielded by the plastic casing, which means they lag behind actual cell surface temperature. Important context when comparing to thermocouple readings.
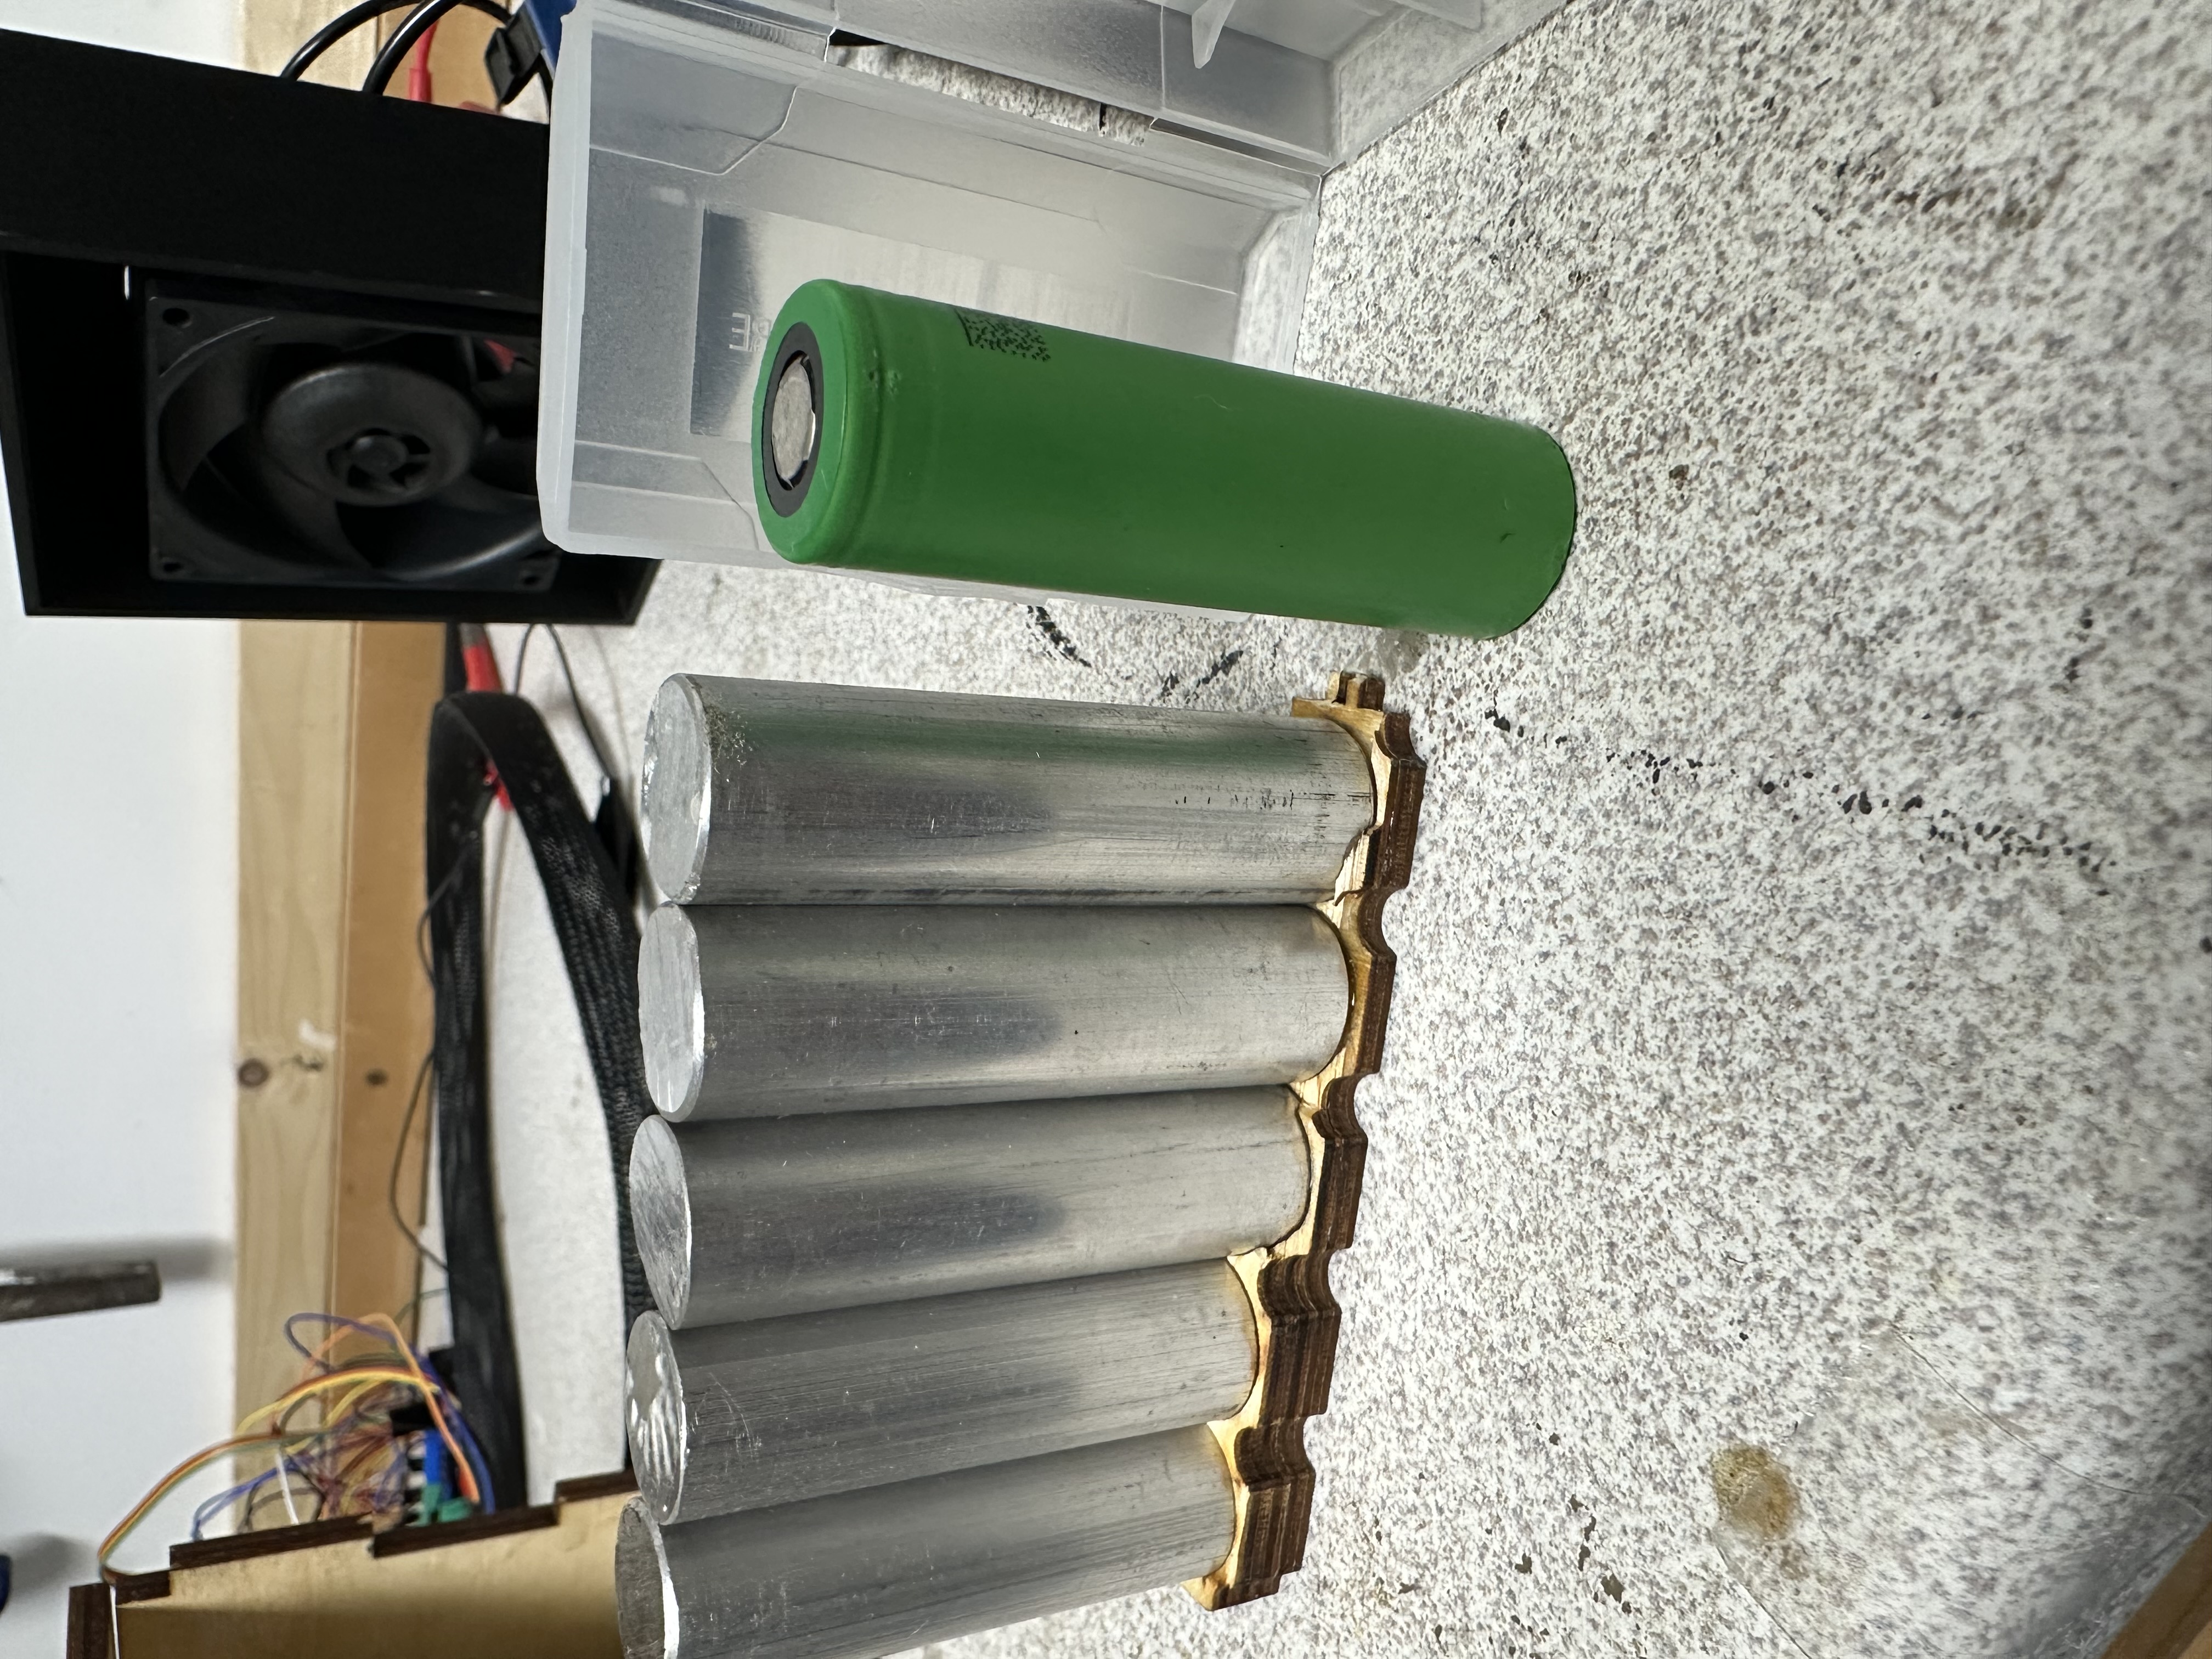
Mock brick vs real VTC6 cell — aluminum has a similar thermal mass and density
Enepaq temperature sensors are shielded by plastic casing — thermistor readings lag actual cell temperature
Mock bricks in airflow segment casing, ESP32 data logger in background
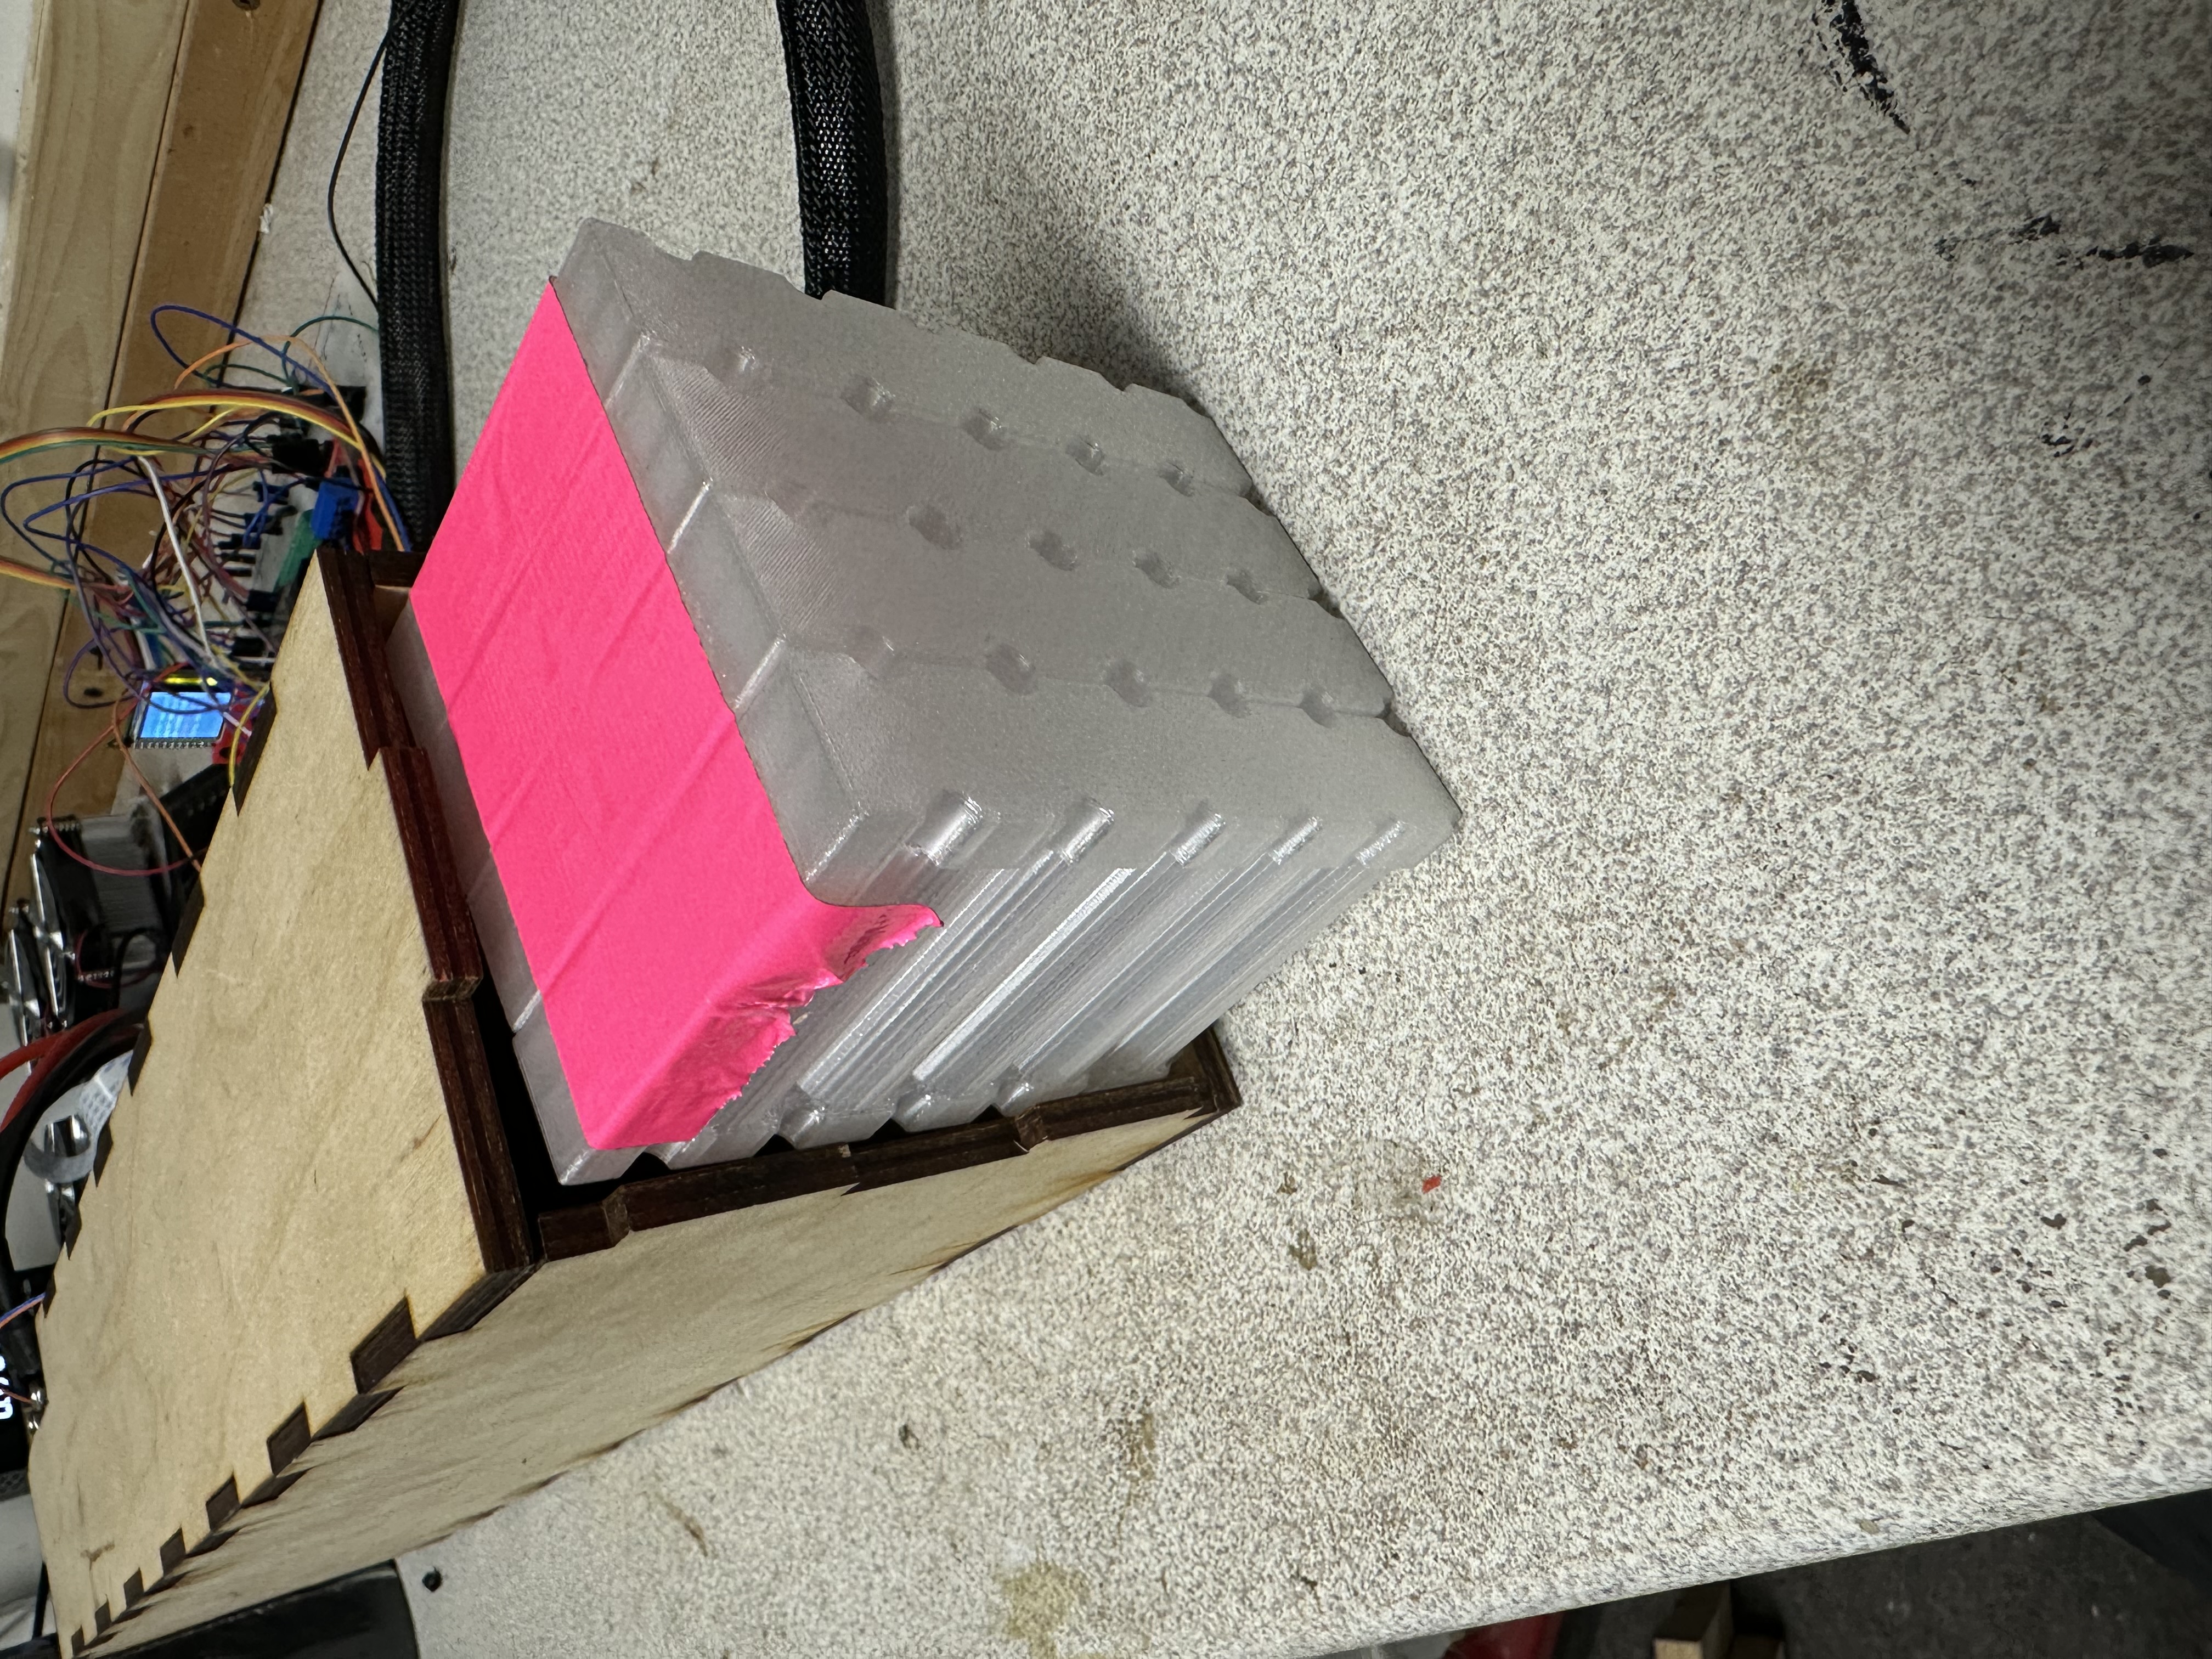
3D printed mock bricks to match system airflow impedance
Clean crimping on high-current cables... less clean ESP32 wiring
For more details on the instrumentation and data logging system, see Battery Cooling Test Setup (documentation in progress).
Data Acquisition Firmware: ESP32 Smart Power Source — the ESP32 code powering temperature sensing, voltage monitoring, and web-based data logging for these tests.
Photos of mock bricks, sensor layout, ESP32 wiring, and equipment
Test Parameters
| Parameter | Value |
|---|---|
| Cell rows | 6 |
| Cells per row | 4 |
| Segment bricks | 1 (of 23 in full pack) |
| Discharge current | 35A constant |
| Start voltage | 4.185V |
| End voltage | 2.8V (most tests) |
| Run | Fan Type | Power | Median h* |
|---|---|---|---|
| Run 1 | 10k Server Fan | 2.75W | 13.4 W/m²K |
| Run 2 | 10k Server Fan | 6.0W | 21.0 W/m²K |
| Run 3 | 10k Server Fan | 10.0W | 23.6 W/m²K |
| Run 4 | 10k Server Fan | 16.0W | 26.2 W/m²K |
| Run 5 | 5015 Blower | 2.75W | 9.3 W/m²K |
*h-coefficient calculated from the hottest cell temperature — this is the conservative approach since we care about the worst-case cell.
A server fan is massive overkill for this application, but it was chosen deliberately to give us flexibility during testing. We could easily characterize performance across a wide power range and have confidence we'd find a workable operating point and better correlation.
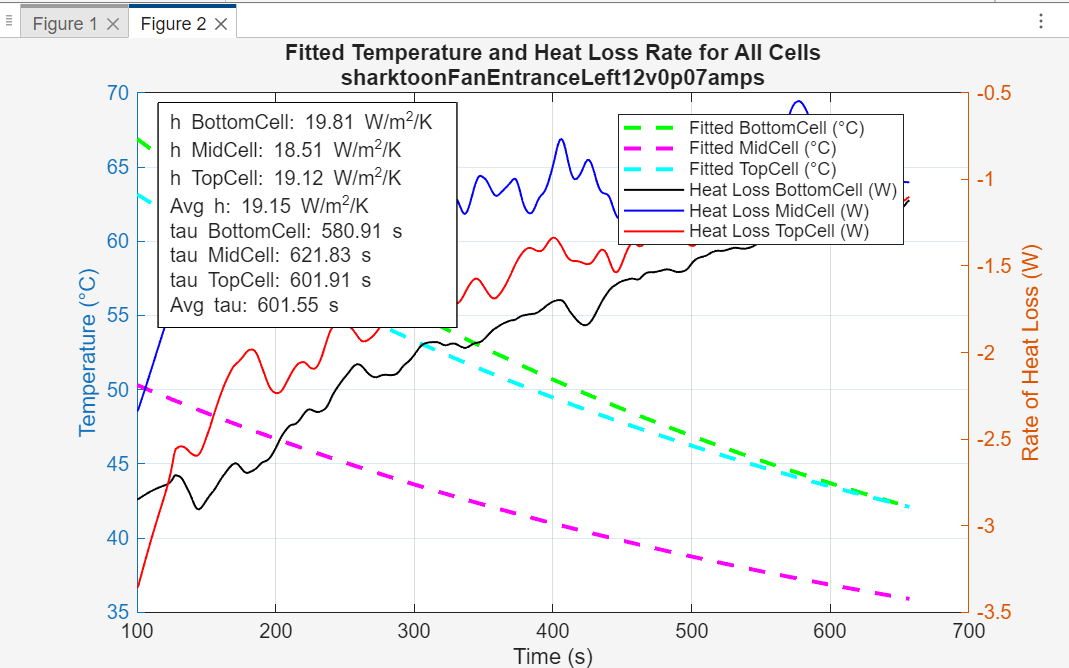
Representative Test Analysis
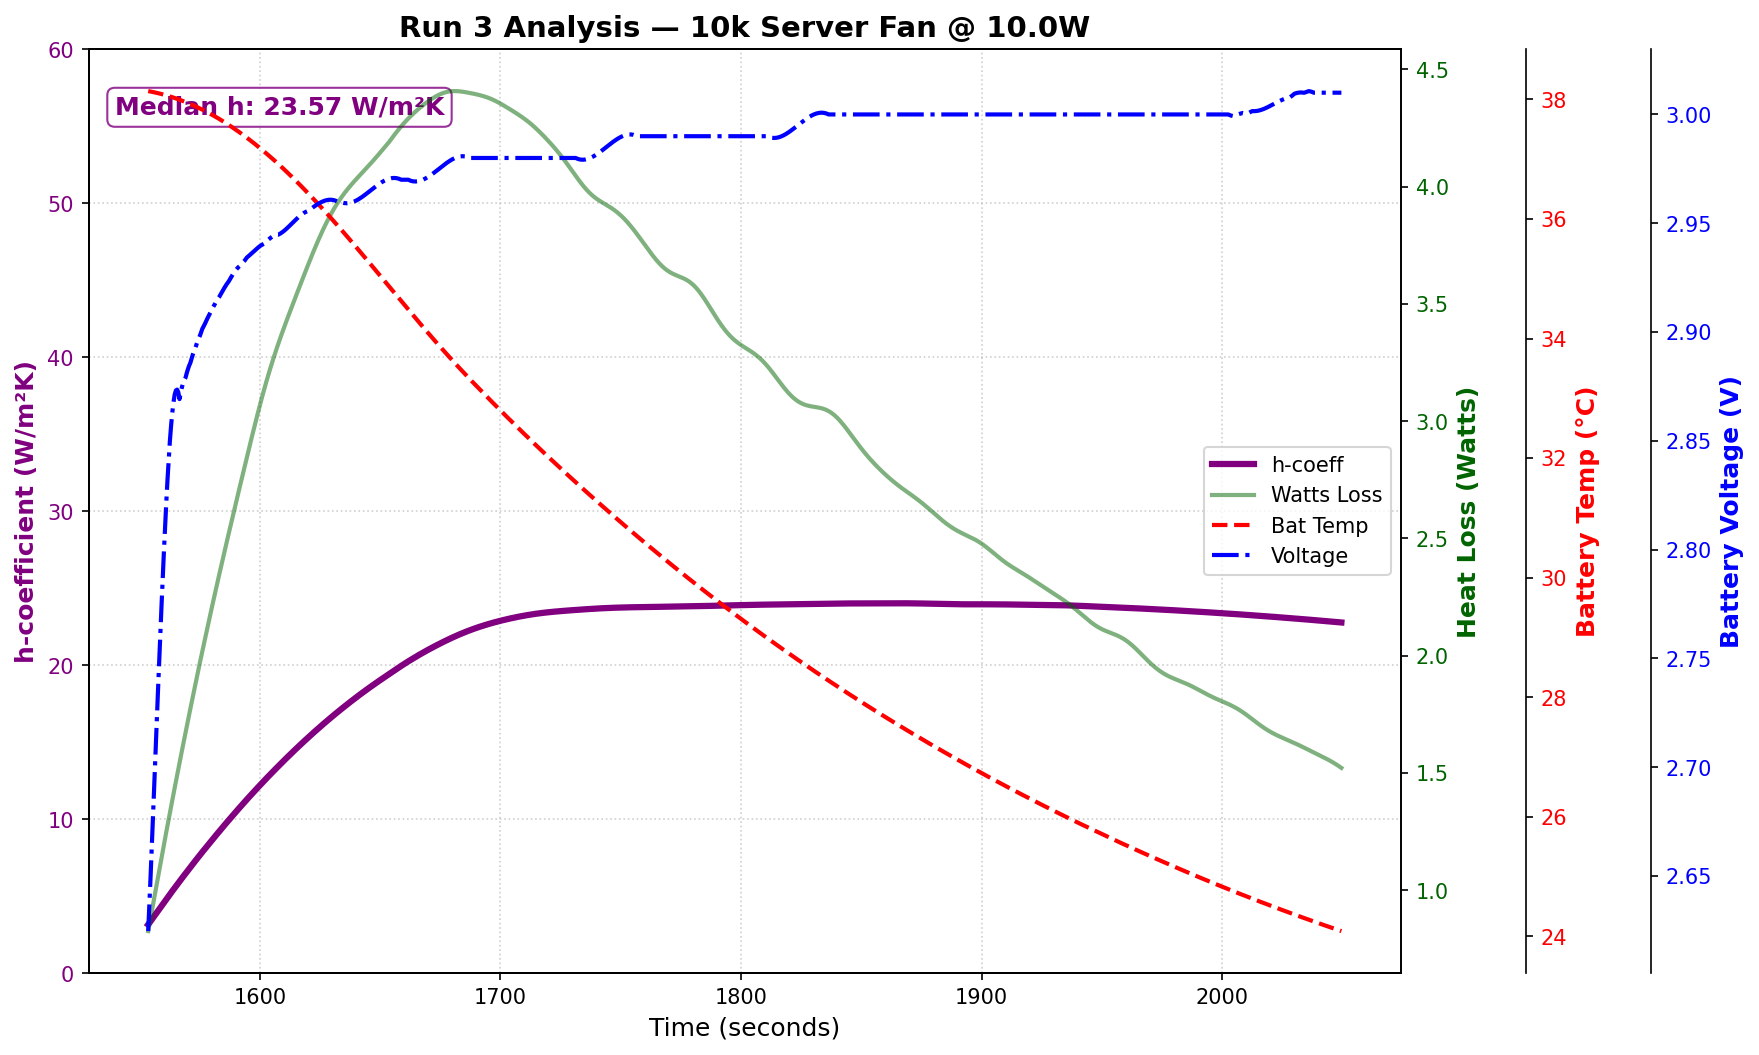
Run 3 (10k server fan at 10W): Four-axis plot showing h-coefficient stabilization, heat loss, temperature decay, and battery(recovery) voltage over time
The h-coefficient calculation uses Newton's law of cooling:
Where:
= thermal mass of cells (5 cells × 49g × 900 J/kg·K) = exposed surface area (90% of cylindrical surface) = temperature difference between cell and ambient
Comparison Across Runs
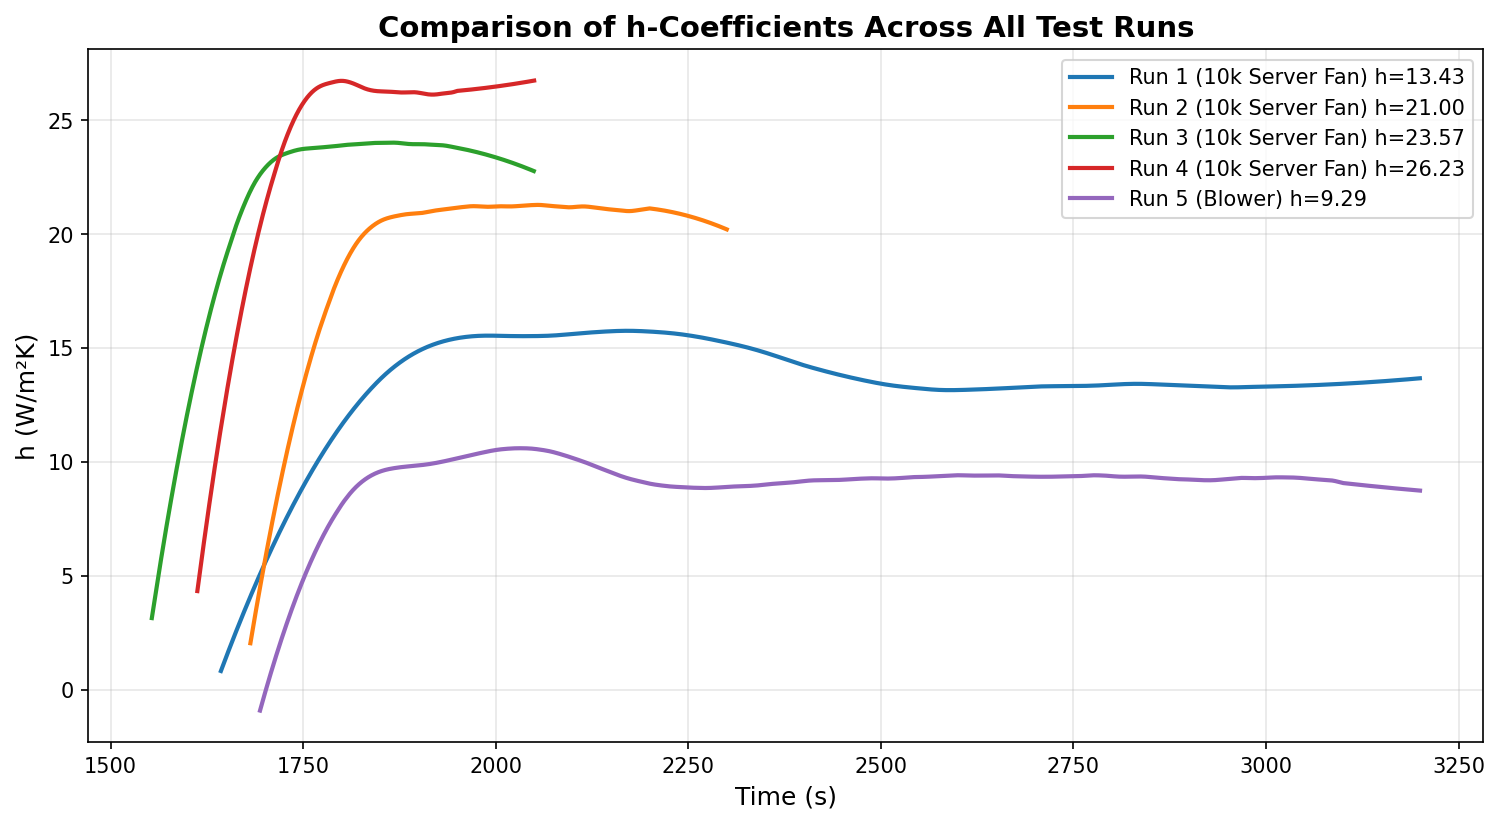
Overlay of h-coefficient vs time for all test runs. Faster cooling = shorter test time. Plots truncated to keep clean data. Median h-coefficient is taken from these graphs to avoid the effect of h rising due to thermal inertia.
Future posts may explore the heat transfer theory behind these tests — thermal time constants, lumped capacitance assumptions, and other rabbit-holes.
Creating Takeaways
This is UVic FSAE's first year with this battery architecture. We're applying conservative safety factors because:
- Overheating = DNF — exceeding 60°C during endurance means we fail
- Data quality will improve — once the car is running, we'll get real-world validation
- We have the budget — our LV power budget can accommodate oversized cooling if needed
Better to be overly cautious now and dial back later.
The Correlation
Power law fit: h = 9.97 × P^0.462 for the 10k server fan configuration, blower immediately seen as less effective even at its max nominal power draw
This correlation is what the testing was for. It allows predicting heat transfer coefficient for any fan power setting without additional physical testing.
Golden Table — w/ High Safety Margins*†
| Run | Fan Config | Power | Median h | Cell ΔT | Air Heating† | Max Safe Ambient |
|---|---|---|---|---|---|---|
| Run 1 | 10k Server | 2.75W | 13.43 | 32.5°C | +11.0°C | 16.5°C |
| Run 2 | 10k Server | 6.0W | 21.00 | 15.3°C | +5.4°C | 39.3°C |
| Run 3 | 10k Server | 10.0W | 23.57 | 13.9°C | +4.4°C | 41.8°C |
| Run 4 | 10k Server | 16.0W | 26.23 | 12.4°C | +3.5°C | 44.1°C |
| Run 5 | Blower | 2.75W | 9.29 | 28.8°C | +15.0°C | 16.3°C |
*Max Safe Ambient = 60°C limit − Cell ΔT − Air Heating offset
†Air heating estimates depend heavily on mass flow rate. Mass flow wasn't measured directly — it was back-calculated from the h-coefficient correlation to airspeed. This table will be updated once I measure actual volumetric flow rate with my "low-backpressure trash bag air catcher" (yes, it's exactly what it sounds like).
Air Temperature Gradient
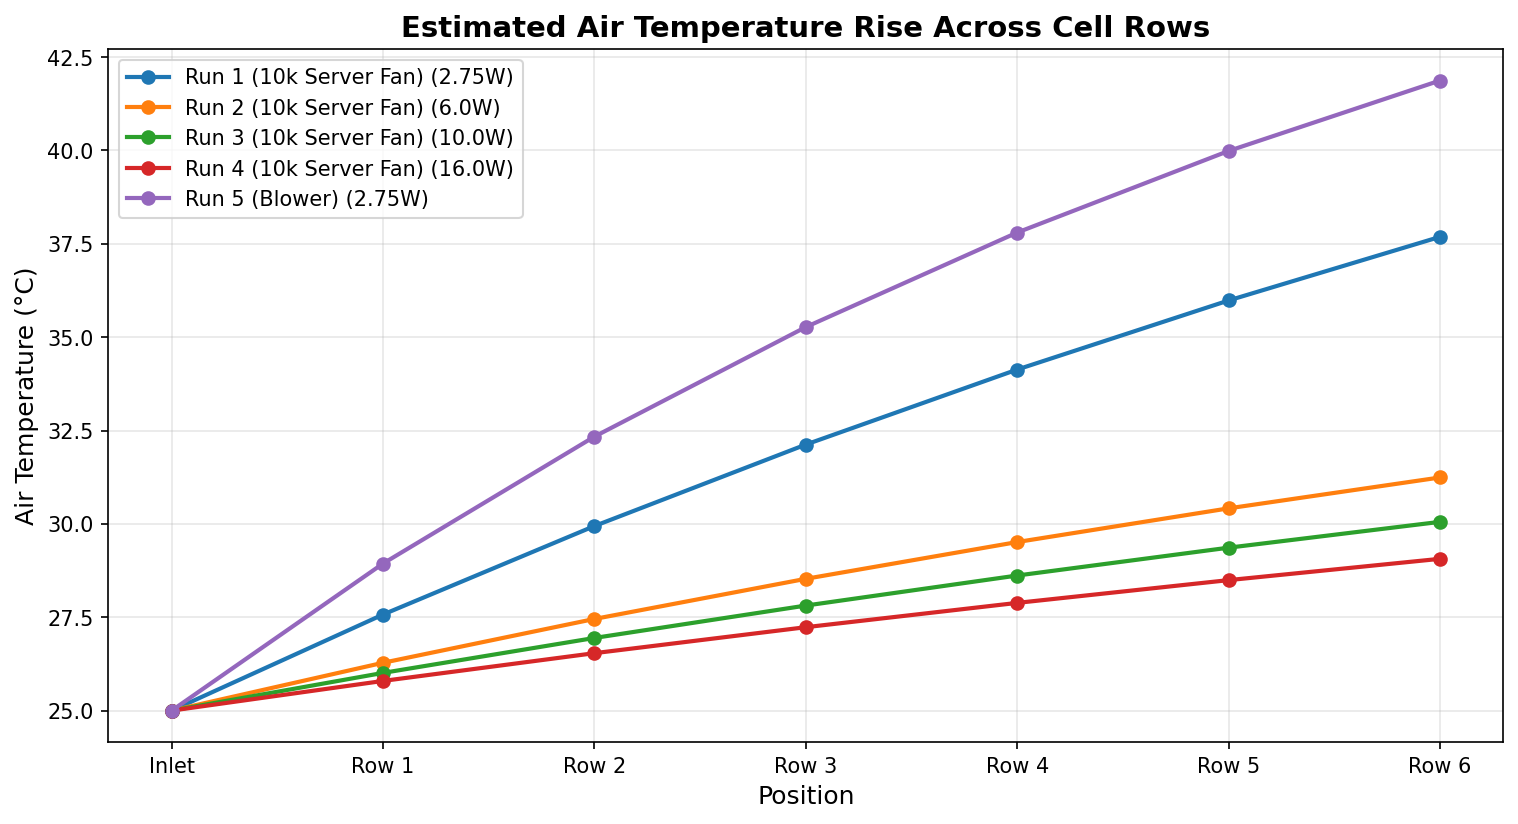
Estimated air temperature rise across 6 cell rows — higher fan power reduces cumulative heating
These curves rely on estimated mass flow. Direct measurement will improve accuracy significantly.
Design Implications
- Fan selection: Server fans actually outperform blowers at equivalent power — this was unexpected. The 10k server fan handles both static pressure and high airflow well.
- Operating point: 6W fan power provides h ≈ 21 W/m²K, sufficient for almost all race conditions (ambient < 39°C)
- Blowers inadequate: Same power input yields ~30% lower h-coefficient, unexpected result
- Room to optimize: Very confident we can downgrade to a 7k RPM fan and still meet thermal requirements with margin
Analysis Code
Full analysis notebook: HCoeffFindingEnepaqCooling (Jupyter notebook - not published)
Processing pipeline:
- Smoothing for noise reduction
- Newton's law of cooling for h-coefficient extraction
- Power law curve fitting for correlation
- Row-by-row air temperature gradient simulation
Future Work
Areas for further investigation:
- Weather statistics to make decisions on ambient conditions at competition venues
- Effect of additional heating from sun exposure and hot pavement
- Pre-cooling strategies (ice intake air) for extreme conditions
- Trash-bag air measurement test.